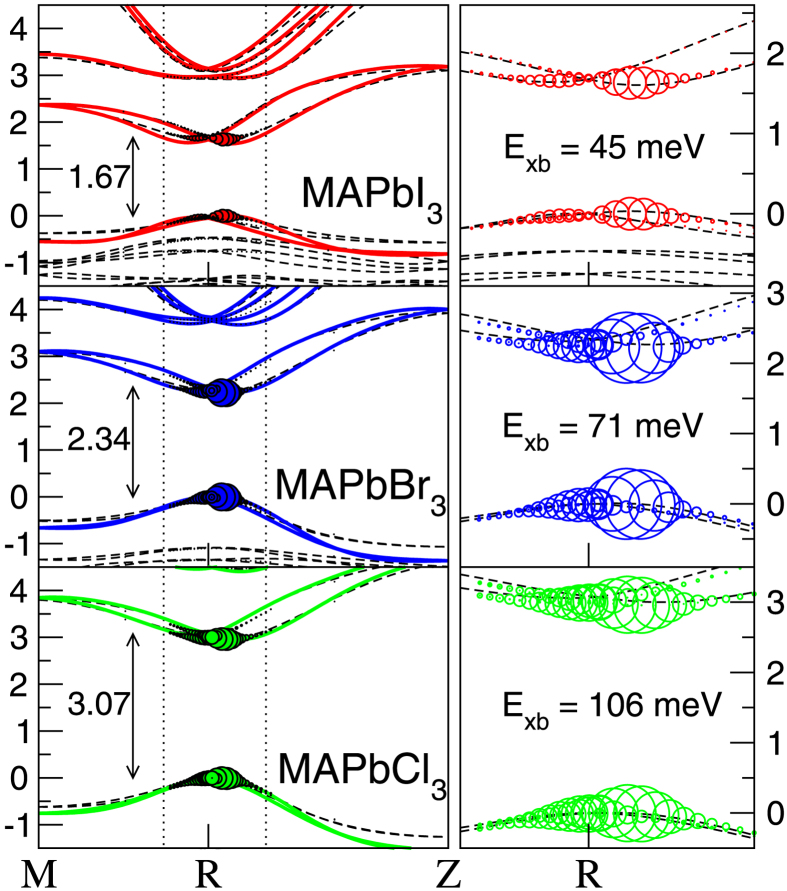
Figure 1. Fast band picture of excitons in MAPbX3.
Left: GW0 band structure of MAPbX3 in the pseudo-cubic phase, with X = I (red), Br (blue) and Cl (green) determined by Wannier interpolation64 from a calculation using 4 × 4 × 4 k-points. The band gaps at R are indicated in eV. The dashed lines in the background are the corresponding DFT+scissor band structures. Right: Zoom-in of the band structure (marked by the dotted lines) close to the R point. The radii of the circles represent the contribution of the e-h pair at that k-point ( ) to the first exciton wave function.

