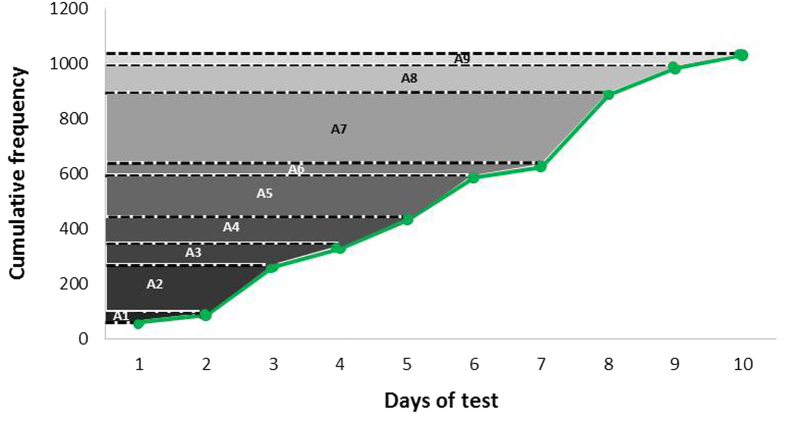
Figure 2. Schematic view of area calculations.
See impacts on the most recent choices in a series of consecutive choice tests. Data obtained from fish 6 to visualize calculations of the areas (A1 to A9) above the line of cumulative frequencies. This assumption implies that unit 1 will always result in a higher area in subsequent tests.

