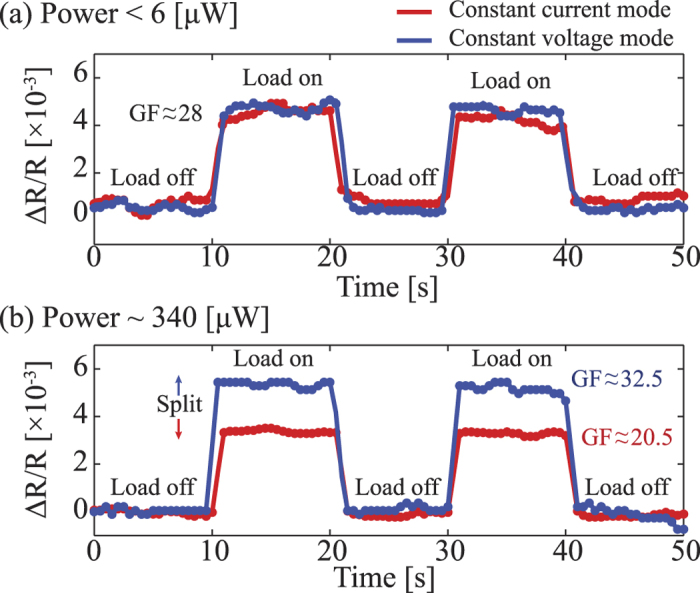
Figure 6. Characterization of the piezoresistive effect at high temperature using the Joule heating effect.

The relative resistance change at (a) small applied power (b) high applied power. The red line shows the output of the constant current mode, while the blue line illustrates the output of the constant voltage mode.
