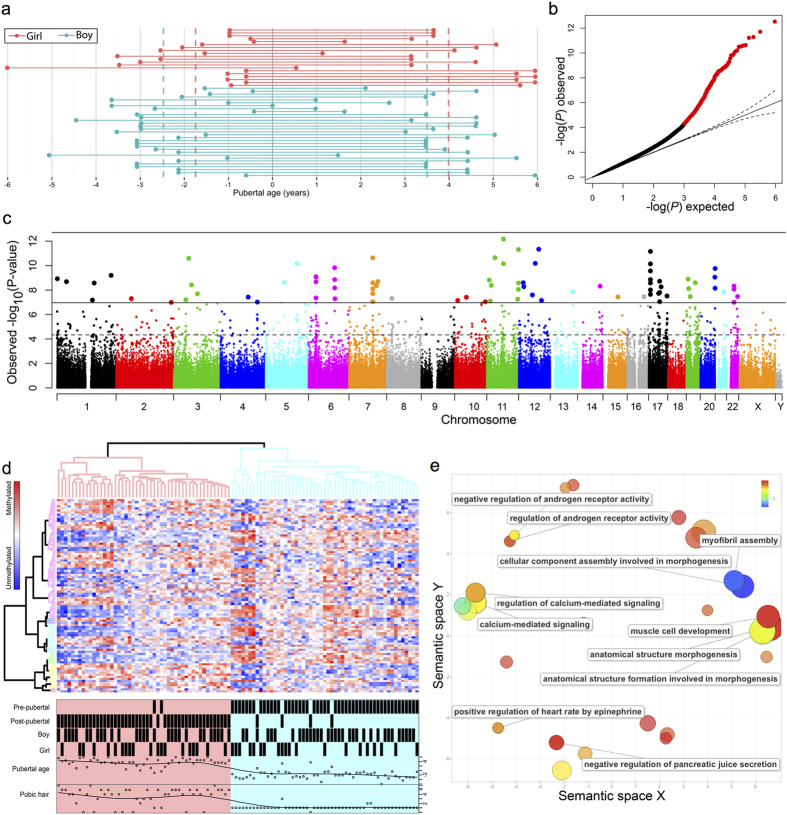
Figure 1. Identification of CpGs associated with pubertal age.
(a) From the COPENHAGEN puberty study of children followed longitudinally, selected pre- and post-pubertal samples from 31 boys and 20 girls were included in the study. Time relative to onset of puberty as measured by a testicular volume of 4 ml or breast tanner stage B2 or above was calculated and defined as the pubertal age. (b) Genomic inflation of the genome-wide DNA methylation patterns correlating with pubertal age were corrected by applying an improved surrogate variant analysis (SmartSVA) resulting in a genomic inflation factor of 1.2 and a qq-plot leaving 457 significant CpG sites at a FDR of 0.05 (red). (c) Manhattan plot of the significant CpG sites reveal a distribution across all autosomes. (d) Unsupervised hierarchical centroid clustering of CpGs associated with pubertal age. The resulting dendrograms were colour coded according to their height and divided samples into two major groups that nearly uniquely represented pre- and post-pubertal boys and girls. (e) Gene ontology analysis of all significant CpGs revealed several ontologies (p-value < 0.05) that could be related to pubertal development. Biological process gene ontologies were plotted in a sematic space, using REVIGO, that groups related ontologies together.

