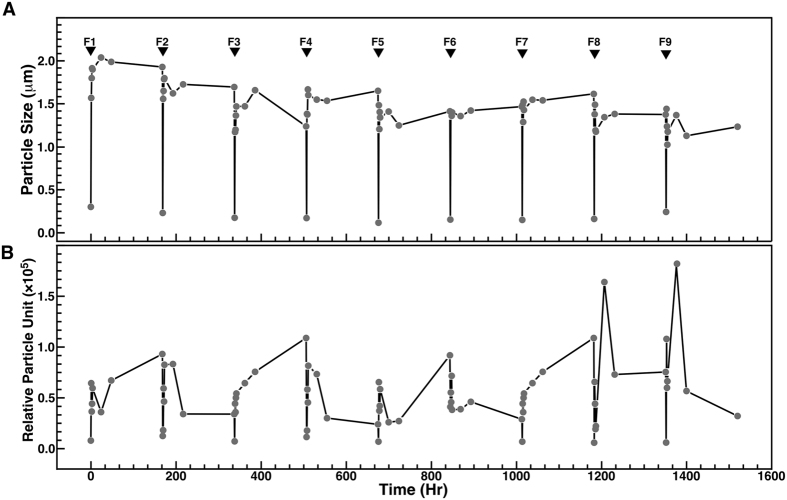
Figure 2. Particle-seeding potential of seawater after successive filtration-incubation cycles.
Seawater was filtered through 0.45-μm pore membranes (inverted black triangles labeled F1 to F9 indicate filtration), prior to incubation at room temperature for the time indicated. Particle size (A) and number (B) was monitored using DLS. Notice the increase of particle size and number following each filtration-incubation cycle. While particles appeared to gradually decrease in size with each filtration-incubation cycle (A), particle number tended to slightly increase during this period (B).

