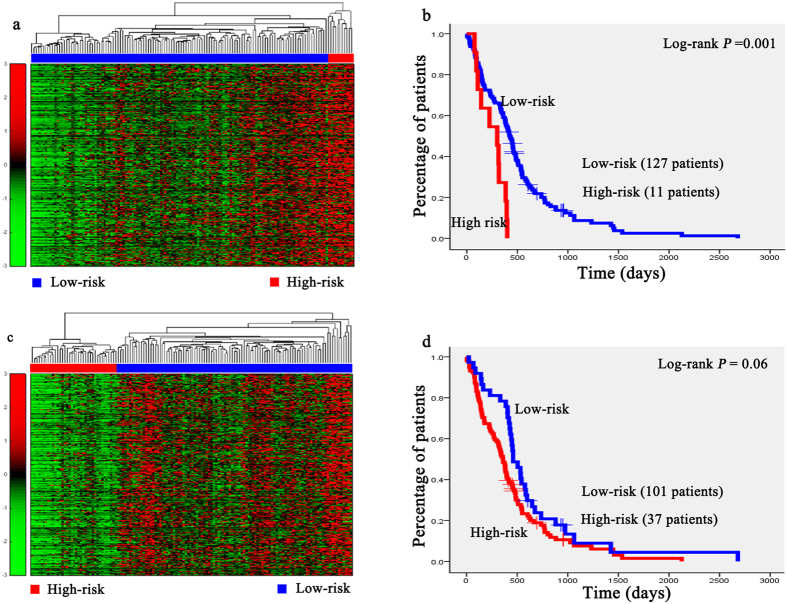
Figure 4. Unsupervised hierarchical clustering of genes in two modules and the Kaplan-Meier analysis of 138 glioblastoma patients of the RNA-sequencing dataset.
(a,c) Unsupervised hierarchical clustering of apoptosis and cell death regulation module and substance biosynthesis and metabolism module of RNA-sequencing data of glioblastoma. According to expression profiles of 1417 genes and 794 genes in two modules, 138 patients were clustered into two groups. The blue bar above the patients indicates the low risk group, the red bar indicates the patients with high risk. (b,d) Kaplan-Meier survival plots of low risk and high risk RNA-sequencing data of glioblastoma patients based on the hierarchical clustering results of (a,b). The gene expression signature in apoptosis and cell death regulation module of the patients in high risk (red lines) with a significantly increased risk of death when compared to low risk group (blue lines).

