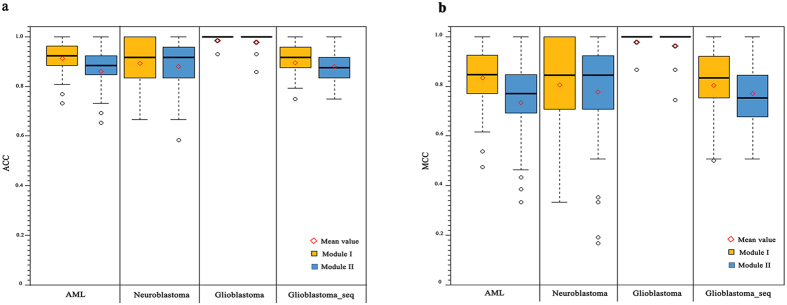
Figure 6. Performance of the 100 times re-sampling for each module of four datasets.
(a) The distribution of ACC values of the 100 times re-sampling for module I (left, yellow) and module II (right, blue) of four datasets. (b) The distribution of MCC values of the 100 times re-sampling for module I (left, yellow) and module II (right, blue) of four datasets. is the mean value of the 100 times random re-sampling of each module.

