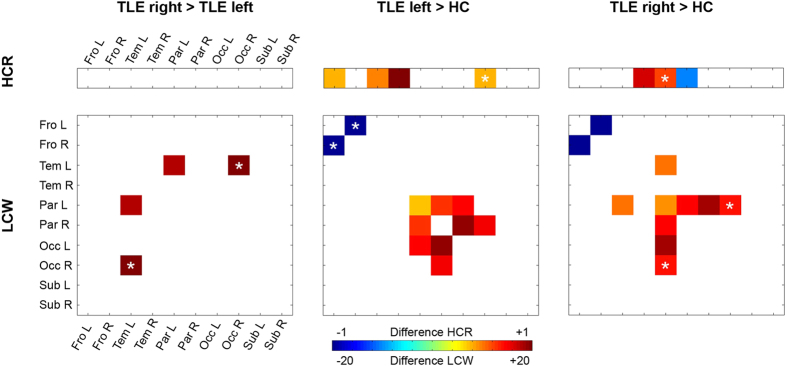
Figure 2. Graph theroretical properties, hemispheric connectivity ratio (HCR) on the upper hand and lobar connectivity weight (LCW) on the lower hand, are depicted for all group comparisons; from left to right: TLE right > TLE left, TLE left > HC, TLE right > HC.
The HCR was analyzed as the ratio between intra- and interhemispheric connections for a particular lobe, whereas a higher ratio states increased connectivity of a lobe within the hemisphere. The LCW was calculated to quantify connections between any two given lobes. The colour table shows differences in HCR and LCW; blue indicates lowest and red highest molecular connectivity. Asterix in the coloured square depicts a trend towards differences in HCR and LCW for covariates of sex or age.

