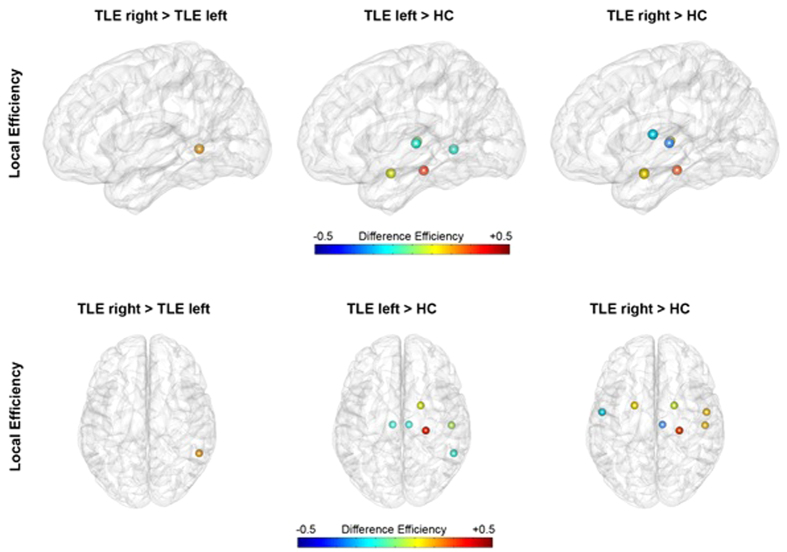
Figure 4. Local graph theory parameters showing significant differences between patients with RTLE and LTLE and between the two patient groups and the healthy control group.
Upper images depict the brain from the left side, lower images from above. The left hemisphere represents the contralateral hemisphere for both groups shown in radiological convention (right hemisphere in all images is the contralateral hemisphere). Local efficiency was found to be higher in the middle temporal region of the contralateral hemisphere in patients with RTLE, when comparing patients groups. Compared to HC, both patient groups showed alteration of local efficiency in several brain regions, predominantly in the contralateral hemisphere.

