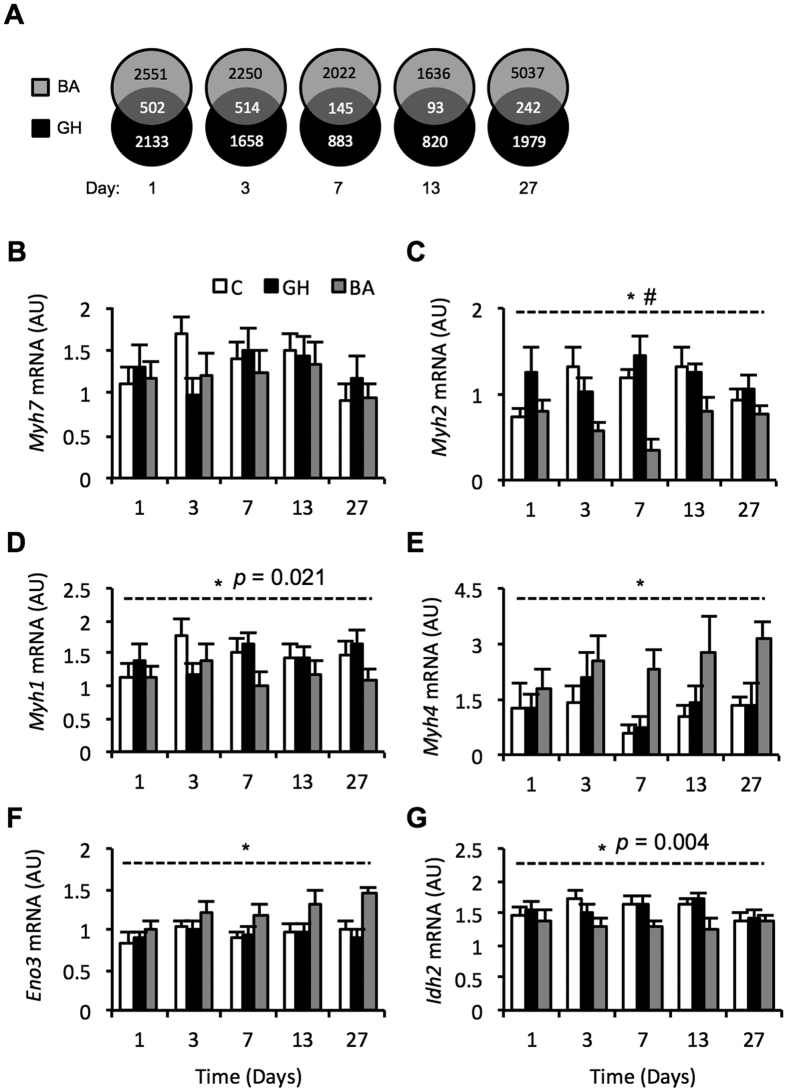
Figure 2. Differentially expressed microarray probes (p < 0.05) and changes in muscle fibre type-specific gene expression in porcine Longissimus Dorsi muscle during 1–27 days of treatment with anabolic agents.
Numbers in the overlapping section of the venn diagrams represent shared differentially expressed probes by treatment with a beta-adrenergic agonist (grey circles; BA) and recombinant growth hormone (black circles; GH) (A). Porcine Longissimus Dorsi muscle transcript abundance of myosin heavy chain isoform genes during 1–27 days exposure to beta-adrenergic agonist (grey bars; BA) or recombinant growth hormone (black bars; GH) treatment compared to a control cohort (white bars; C); Myosin heavy chain I: Myh7 (B), Myosin heavy chain IIA: Myh2 (C), Myosin heavy chain IIX: Myh1 (D), myosin heavy chain IIB: Myh4 (E). Metabolic genes Enolase 3: Eno3 (F), and Isocitrate dehydrogenase 2: Idh2 (G), were measured as indicators of glycolytic and oxidative gene expression, respectively. Data is mean ± SEM. n = 10 for days 1, 3, 7 and 13, whilst n = 15 for day 27. *Indicates a significant treatment effect with p < 0.001 (unless otherwise stated). #Indicates a significant treatment x time interaction with p < 0.05.

