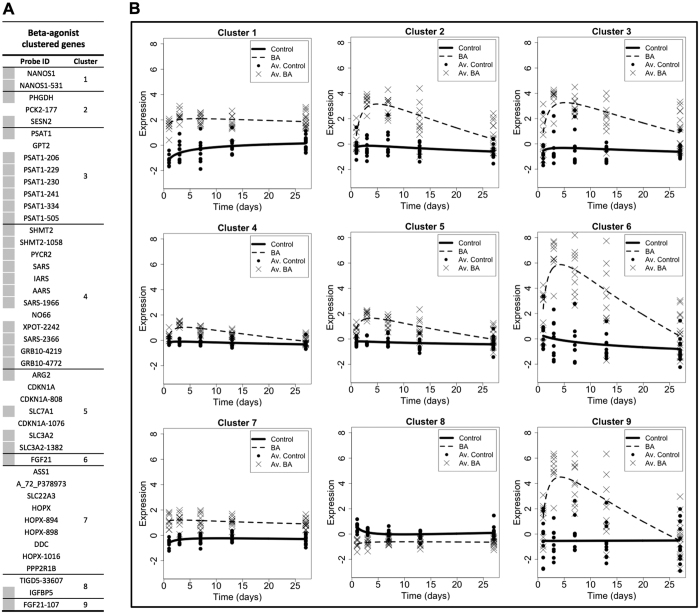
Figure 3. MaSigPro clustering of differentially expressed microarray probes (p < 0.05) generated using RNA from beta-adrenergic agonist (thin dashed line; BA) treated Longissimus Dorsi (LD) muscle, compared to non-treated controls (solid thick line).
Clustering of probes was conducted using a significance of p < 0.05 and a stringency R2 value of 0.5. The table of clustered microarray probes (A) displays the Probe ID (with gene name if known), the cluster group, and a grey square if that probe was also clustered in the equivalent analysis for growth hormone treated samples (see Fig. 4). The 9 clustered probe plots (B) display time on the x-axis (spanning the treatment duration of 1–27 days) with relative expression on the y-axis. Each plot depicts the expression profile of the microarray probes within that cluster for beta-adrenergic agonist (BA) treated and non-treated control animals. n = 10 for days 1, 3, 7 and 13, whilst n = 15 for day 27. Av. indicates average.

