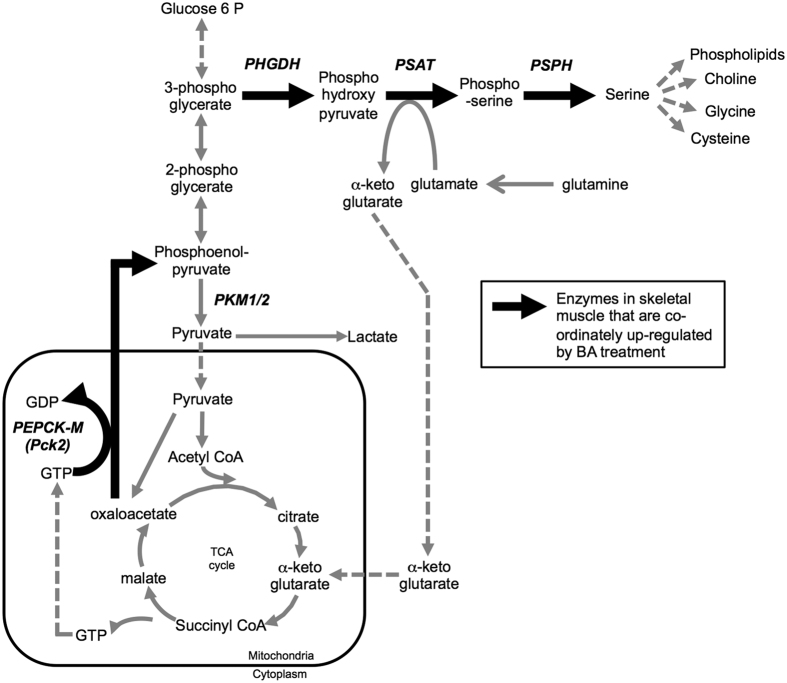
Figure 6. A schematic illustrating the relationship between glycolysis, the TCA cycle and pathways associated with serine/one-carbon/glycine (SOG) biosynthesis.
Bold black arrows indicate enzymes that were up-regulated at the mRNA (Pck2, Phgdh, Psat1, Psph) and/or protein level (PEPCK-M and PHGDH) by beta-adrenergic agonist treatment.

