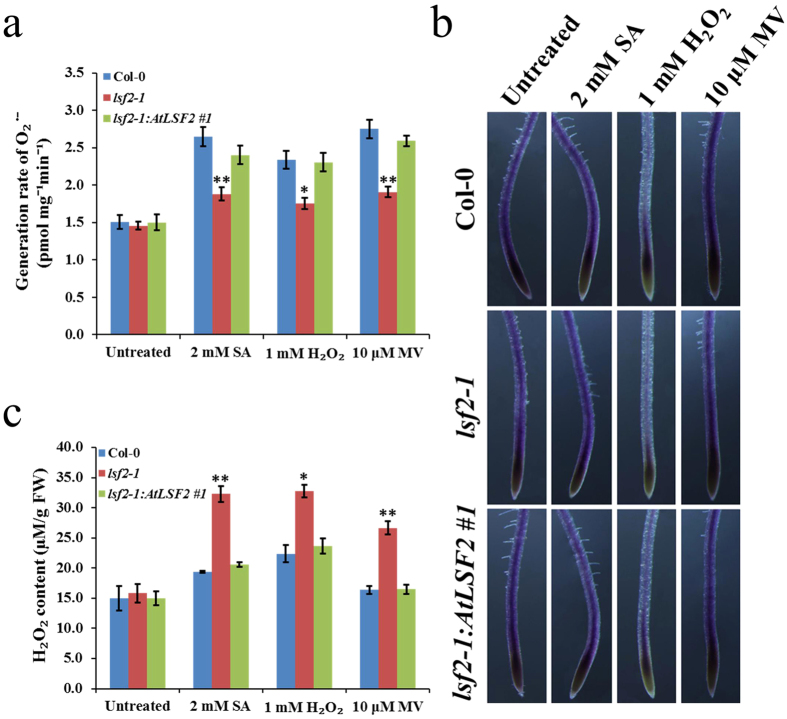
Figure 1. Generation rate of O2•− and H2O2 content in plants.
The generation rate of O2•− (a) or endogenous H2O2 content (c) was examined after pre-treated with SA, H2O2 or MV (mean values ± SE, n = 3; student’s t-test, *P < 0.05; **P < 0.01). (b) NBT stained main roots that were pre-treated with SA, H2O2 or MV.

