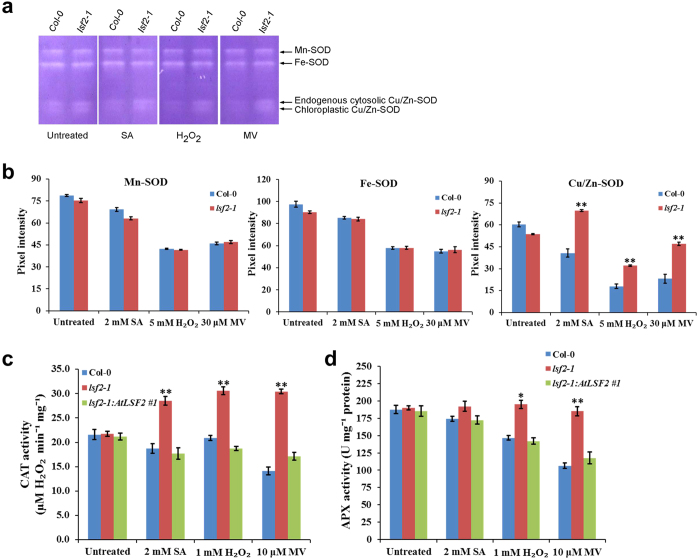
Figure 2. The activities of ROS antioxidant enzymes in plants.
(a) SOD activity was examined by NBT staining after non-denaturing PAGE. (b) Pixel intensity of SODs was calculated using a plot profile. CAT activity (c) and APX activity (d) were examined after pre-treatment with SA, H2O2 or MV (n = 3; student’s t-test, *P < 0.05; **P < 0.01).

