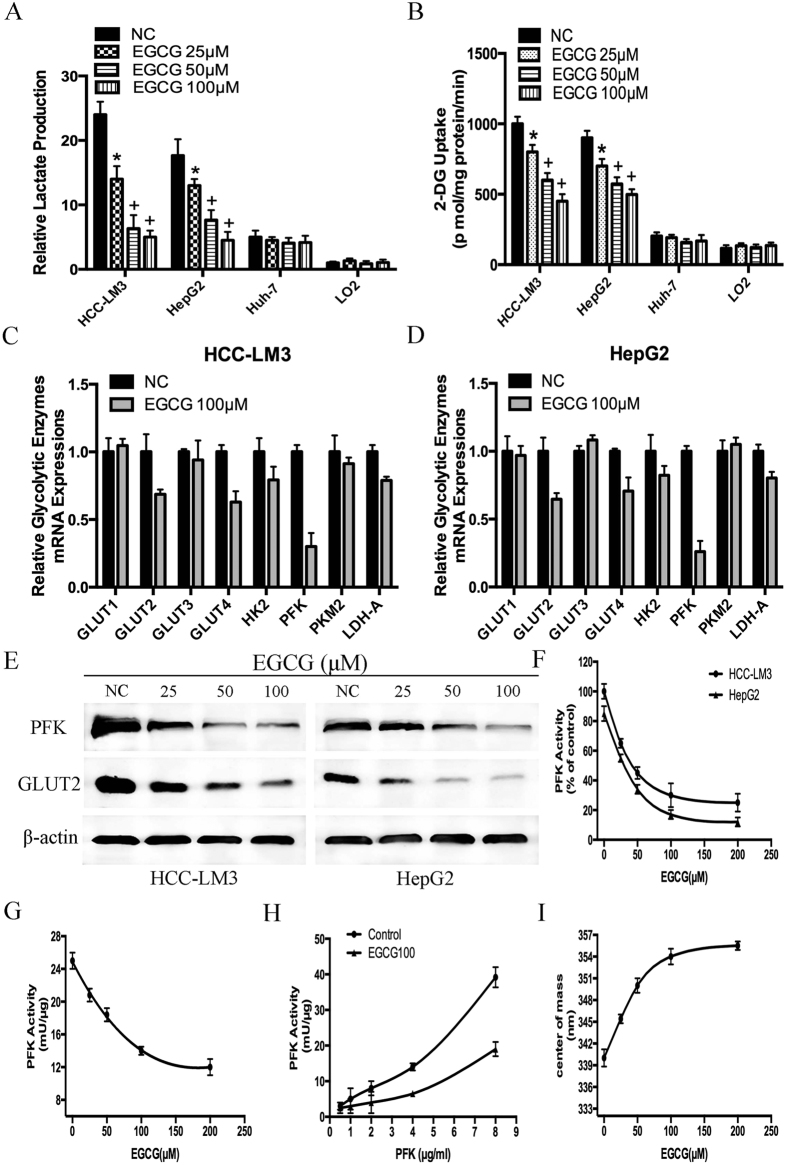
Figure 2. Effects of epigallocatechin-3-gallate (EGCG) on HCC cells glucose consumption, lactate production and PFK expression and activity.
(A,B) Relative lactate production and 2-DG uptake from HCC cell lines (HCC-LM3, HepG2 and Huh-7) and normal hepatic cells (LO2) in the absence or presence of EGCG (25, 50, and 100 μM) within 24 h of culture under normoxic conditions. (C,D) qRT-PCR analysis of the effect of EGCG (100 μM) on the expression of genes associated with glycolysis in HCC cells. (E) Western blot analysis of EGCG (0, 25, 50, and 100 μM) on the protein expression of PFK and GLUT2 in HCC-LM3 and HepG2 cells. β-actin was used as a loading control. (F) Spectrophotometric analysis of the effect of EGCG (0, 25, 50, 100 and 200 μM) on PFK activity in HCC-LM3 and HepG2 cells. (G) Purified PFK activity was evaluated as described through the radiometric assay, in the presence of the desired concentrations of EGCG (25, 50, 100 and 200 μM). (H) PFK titration curve of enzyme-specific activity in the absence and presence of 100 μM EGCG. (I) Purified PFK was incubated for 1 h in the presence of the various concentrations of EGCG (0, 25, 50, 100 and 200 μM). The treated enzyme was used to evaluate its quaternary structure, assessing the center of mass of the intrinsic fluorescence spectra. Plotted values represent the mean ± standard error of three independent experiments (n = 3) (*P < 0.05; +P < 0.01).

