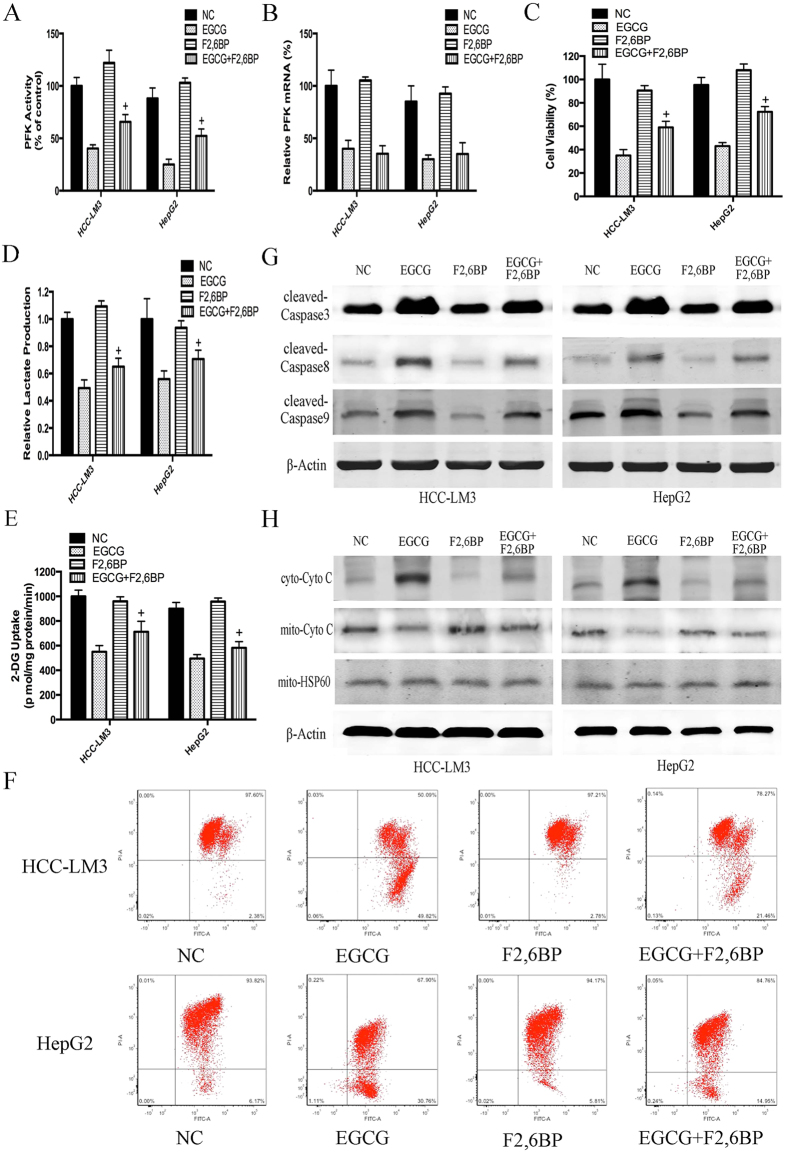
Figure 5. F2,6BP reversed the effect of EGCG on HCC cell glycolysis and apoptosis.
(A–E) HCC-LM3 and HepG2 were treated with EGCG (100 μM) with or without F2,6BP (5 μM) for 24 h. At the time points indicated, the following measurements were performed: PFK activity (A), PFK mRNA expression (B), cell proliferation rate (C), lactate production (D), 2-DG uptake (E). (F) To measure changes in the Δψm, cells (5 × 10⁴) treated with EGCG with or without F2,6BP were stained with JC-1 (10 μg/ml) and analyzed by flow cytometry. (G,H) Western blot analysis of cleaved-caspase 3, cleaved-caspase 8, cleaved-caspase 9, mito-cyto c and cyto-cyto c in HCC-LM3 and HepG2 cells treated EGCG with or without F2,6BP for 24 h. Actin and hsp-60 served as loading controls. Plotted values represent the mean ± standard error of three independent experiments (n = 3) (+P < 0.01).

