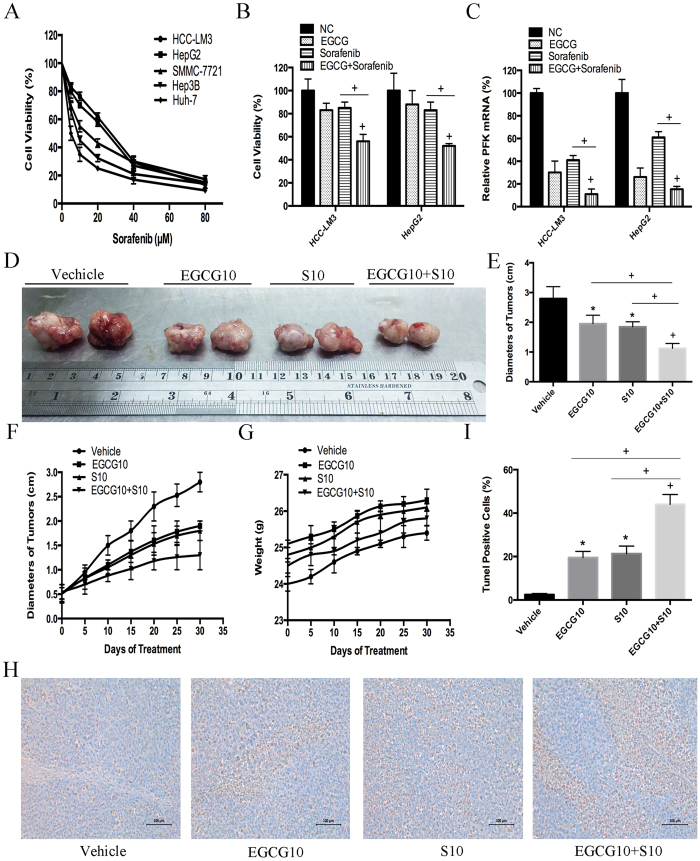
Figure 8. EGCG increased sorafenib induced cell growth inhibition in both sorafenib-resistant HCC cells and nude mice bearing xenograft tumors.
(A) After sorafenib (5–80 μM) treatment for 24 h, HCC cells (5 × 10⁴) were harvested and analyzed for cell growth inhibition using the CCK-8 assay. (B,C) HCC-LM3 and HepG2 cells were exposed to EGCG (25 μM), sorafenib (5 μM), or combination treatment for 24 h, cell proliferation was analyzed using the CCK-8 assay (B), and PFK mRNA expression was tested using qRT-PCR (C). (D–I) In a xenograft mouse model, mice were treated with EGCG (10 mg/kg BW per day) alone, sorafenib (10 mg/kg BW per day) alone, or combination treatment for 30 days. At the time points indicated, the following measurements were performed: diameter of tumors (D,E), changes in the diameter of tumors (F), changes in body weight (G), and the percent of TUNEL-positive tumor cells (H,I). Plotted values represent the mean ± standard error of three independent experiments (n = 3) (*P < 0.05; +P < 0.01).

