
Figure EV2. Illustrations of maximum/minimum Feret diameters.
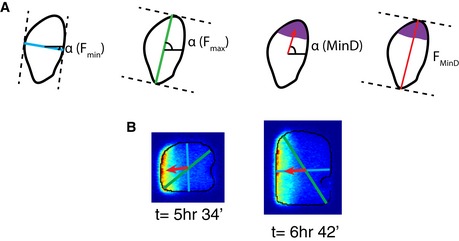
- From left to right showing the minimum Feret diameter and its angle, the maximum Feret diameter and its angle, the angle of the MinD polar zone, and the Feret diameter corresponding to this angle.
- Two examples of Feret diameters and angles in the cell shown in Fig 5D–F.