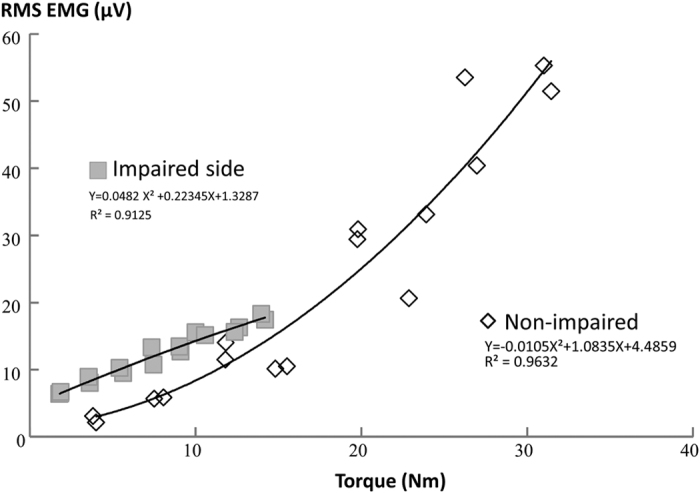
Figure 3. A representative EMG-torque relation on impaired and non-impaired sides in a stroke subject.

The relation from the channel with the highest EMG values was selected. The figure was plotted from EMG and torque values for each repetition (x2 rep) at each target level (x8, from 10–80% MVC) for each side. There were 16 data points for each side. However, some data points were missing because some repetitions generated the same or very close EMG/Torque values.
