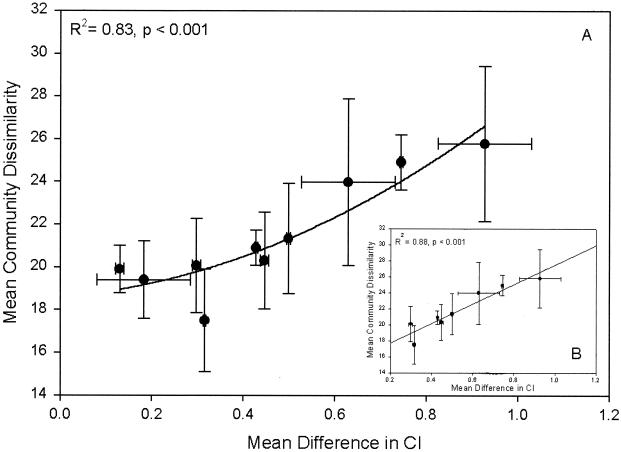
FIG. 3.
(A) Mean percentages of dissimilarity in community composition as determined by DGGE pattern analysis versus the difference in CI between treatments. (B) Mean percentages of dissimilarity in community composition versus the difference in CI for treatment levels that differ by more than 0.2 CI units.

