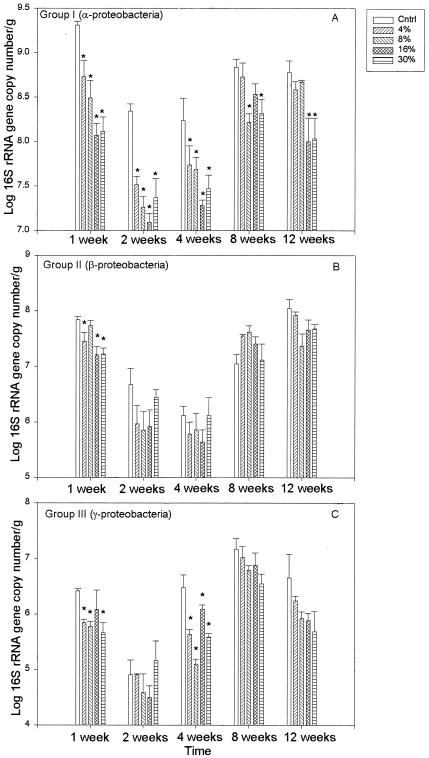
FIG. 5.
Means and standard errors of group-level abundance measured in each treatment level at 1-, 2-, 4-, 8-, and 12-week time points. (A) Means and standard errors of group I abundance. (B) Means and standard errors of group II abundance. (C) Means and standard errors of group III abundance. Stars indicate treatment levels at which group-level abundances are significantly (P < 0.05) lower than those seen with the control for each time point.

