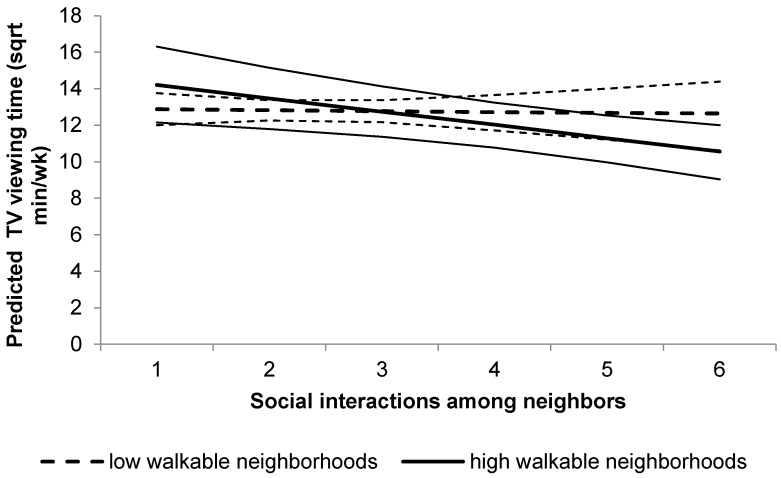
Figure 2.
Interaction between social interactions among neighbors and neighborhood walkability for the predicted TV viewing time. Plot represents TV viewing levels (square root transformed variable) for high-walkability (thicker full line) and low-walkability (thicker dashed line) neighborhood residents, and their confidence intervals (thinner lines).

