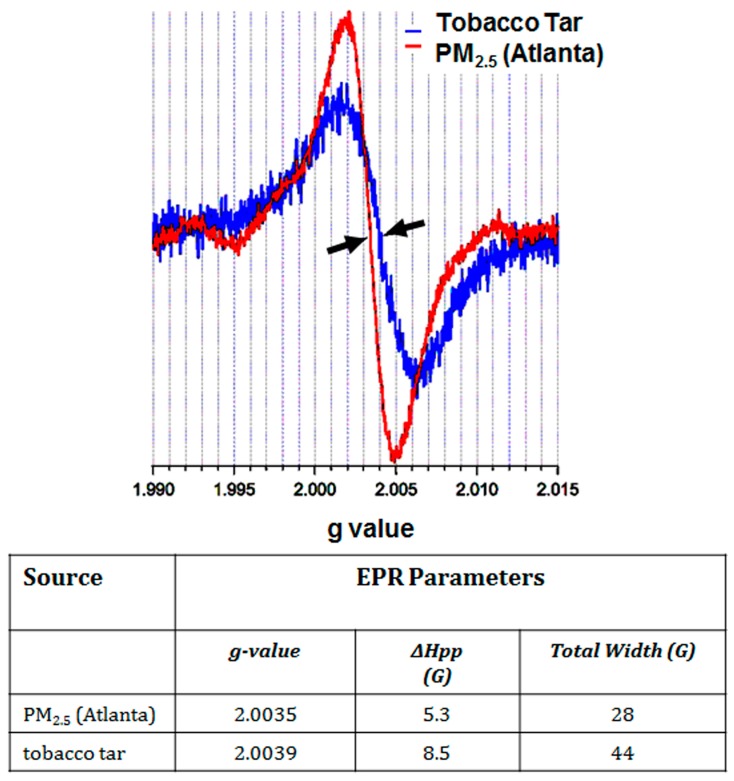
Figure 1.
EPR spectra of ambient air PM2.5 (Atlanta) and cigarette tar, with a centerfield of 3550 Gauss. In both cases, the observed spectra is typical of an EPFR. The larger width of the tobacco tar signal is indicative of more complex convolution due to the presence of multiple radicals. Arrows point to the g-value for each spectrum.

