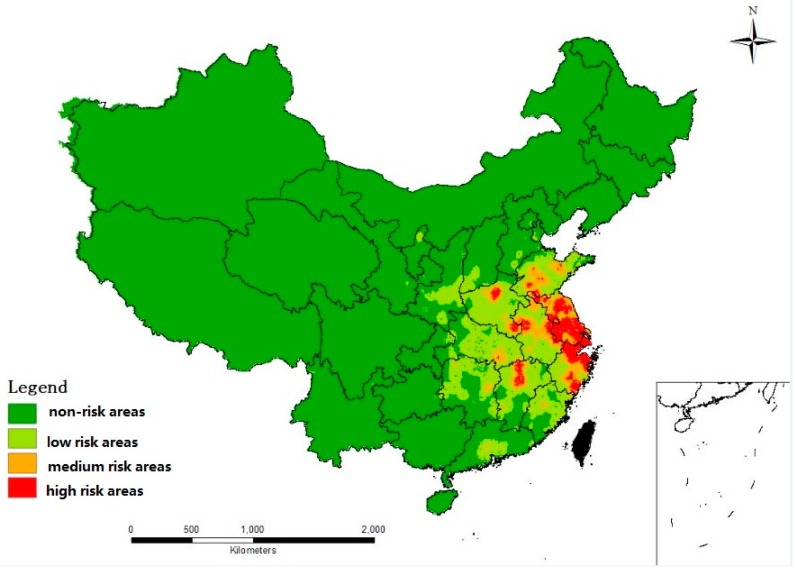
Figure 1.
The map of potential spatial distribution of H7N9 risk in China. Areas with suitable degree values less than 0.01 were regarded as non-risk areas (green color), ranges from 0.01–0.1 were regarded as low risk areas (light green color); ranges from 0.1–0.3 indicated medium risk (orange color), and values over 0.3 indicated high risk (red color).

