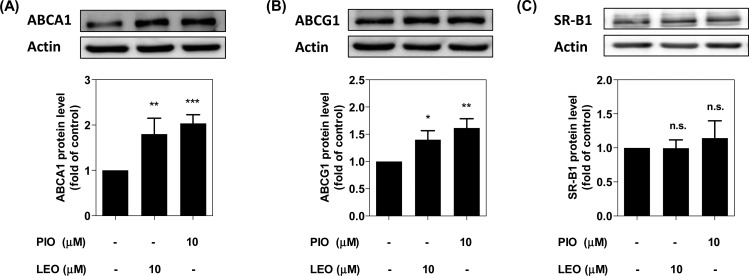
Figure 3.
Leoligin increases ABCA1 and ABCG1, but not SR-B1 protein expression. THP-1 macrophages were treated with leoligin (LEO, 10 μM), pioglitazone (PIO, 10 μM), or solvent control (DMSO) for 24 h. Then, cells were lysed with NP40 buffer. A 20 μg amount of total protein was analyzed by Western blot using anti-ABCA1 (A), -ABCG1 (B), or -SR-B1 (C) antibodies. Band intensities of four independent experiments were quantified. The bar graphs represent mean ± SD, and the statistical evaluation was performed by one-way ANOVA with the Bonferroni post-test. *p < 0.05 versus solvent control (DMSO); **p < 0.01 versus DMSO; ***p < 0.001 versus DMSO; n.s. not significant versus DMSO. For ABCA1 protein level, 95% CI of difference is −1.246 to −0.3587 (LEO, 10 μM) and −1.479 to −0.5911 (PIO, 10 μM); for ABCG1 protein level, 95% CI of difference is −0.6935 to −0.1084 (LEO, 10 μM) and −0.9088 to −0.3237 (PIO, 10 μM); for SR-B1 protein level, 95% CI of difference is −0.3437 to 0.3445 (LEO, 10 μM) and −0.4903 to 0.1979 (PIO, 10 μM).

