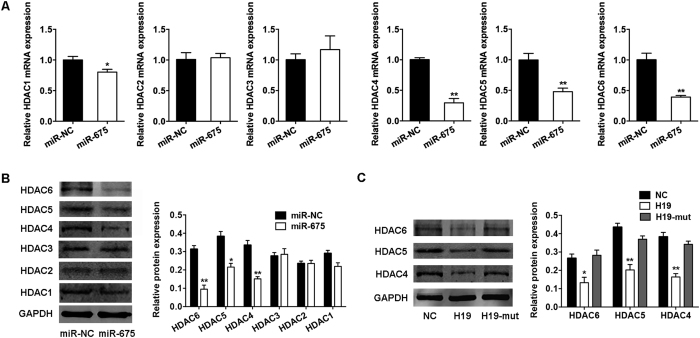
Figure 4. H19 and miR-675 downregulated the expression of HDACs 4, 5, and 6.
(A) Quantification of mRNA expression of HDACs 1–6 measured by qRT-PCR in BMSCs overexpressing miR-675 relative to the miRNA control group (miR-NC). (B) Western blot analysis of HDACs 1–6 and GAPDH in BMSCs overexpressing miR-675 or miR-NC. Histograms show quantification of the band intensities. (C) Western blot analysis of HDACs 4–6 and GAPDH in BMSCs overexpressing H19, H19-mut, and the control vector (NC). Histograms show quantification of the band intensities. Results are presented as mean ± SD (*P < 0.05, **P < 0.01).

