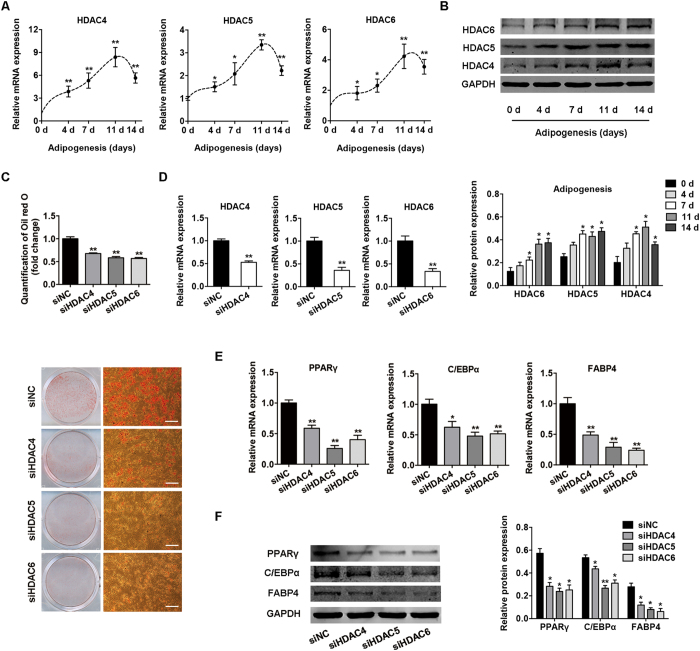
Figure 6. Knockdown of HDACs 4–6 by RNA interference suppressed the adipogenic differentiation of BMSCs.
(A) Relative mRNA expression levels of HDACs 4–6 at the indicated time points during adipocyte differentiation. (B) Western blot analysis of HDACs 4–6 and GAPDH at the indicated time points during adipogenesis. Histograms show quantification of the band intensities. RNA and protein expression at each time point was compared to the group without adipocyte induction. (C) Images of Oil red O staining in BMSCs transfected with specific siRNAs on day 7 of adipogenic differentiation. Scale bar, 500 μm. Histograms show quantification of Oil red O staining normalized to the siNC group. (D) Quantification of mRNA expression of HDACs 4–6 measured by qRT-PCR after transfection with siHDAC4-6 or siNC. (E) Relative mRNA expression of the adipocyte-specific genes PPARγ, C/EBPα, and FABP4 measured by qRT-PCR on day 7 of adipogenic induction in BMSCs transfected with specific siRNAs. (F) Western blot analysis of PPARγ, C/EBPα, FABP4, and GAPDH on day 7 of adipogenic induction in BMSCs transfected with specific siRNAs. Histograms show quantification of the band intensities. Data are shown as mean ± SD (*P < 0.05, **P < 0.01).

