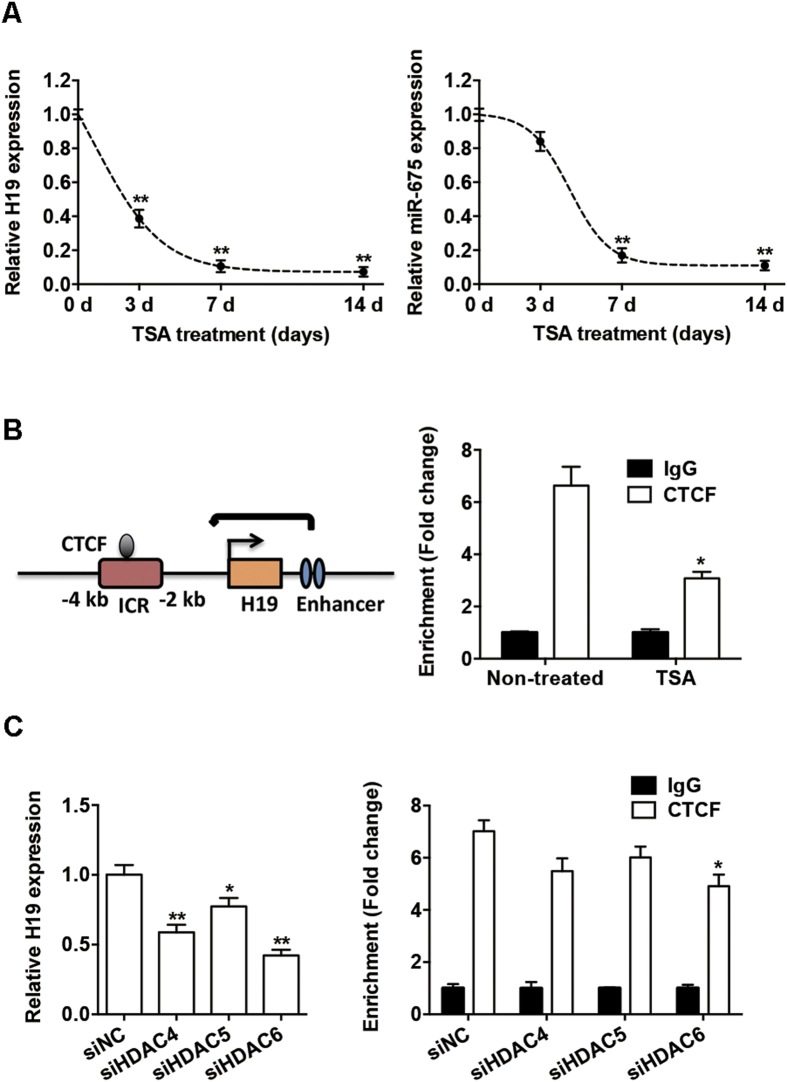
Figure 7. HDAC inhibition reduced the binding of CTCF in the H19 imprinting control region (ICR).
(A) Left: relative expression of H19, as determined by qRT-PCR analysis, in BMSCs with or without TSA (400 nM) for 3, 7, and 14 days. Right: relative miR-675 expression in BMSCs with or without TSA (400 nM) for 3, 7, and 14 days. (B) Left: schematic of the H19 gene locus. Right: ChIP assay of CTCF occupancy in the H19 ICR. Soluble chromatin from BMSCs with or without TSA was immunoprecipitated with CTCF or IgG antibodies, and the immunoprecipitated DNA was analyzed by qRT-PCR. (C) Left: relative expression of H19, as determined by qRT-PCR analysis, in BMSCs transfected with siHDAC4-6 or siNC. Right: ChIP assay of CTCF occupancy in the H19 ICR from BMSCs transfected with siHDAC4-6 or siNC. Data are shown as mean ± SD (*P < 0.05, **P < 0.01, compared with non-treated or siNC group).

