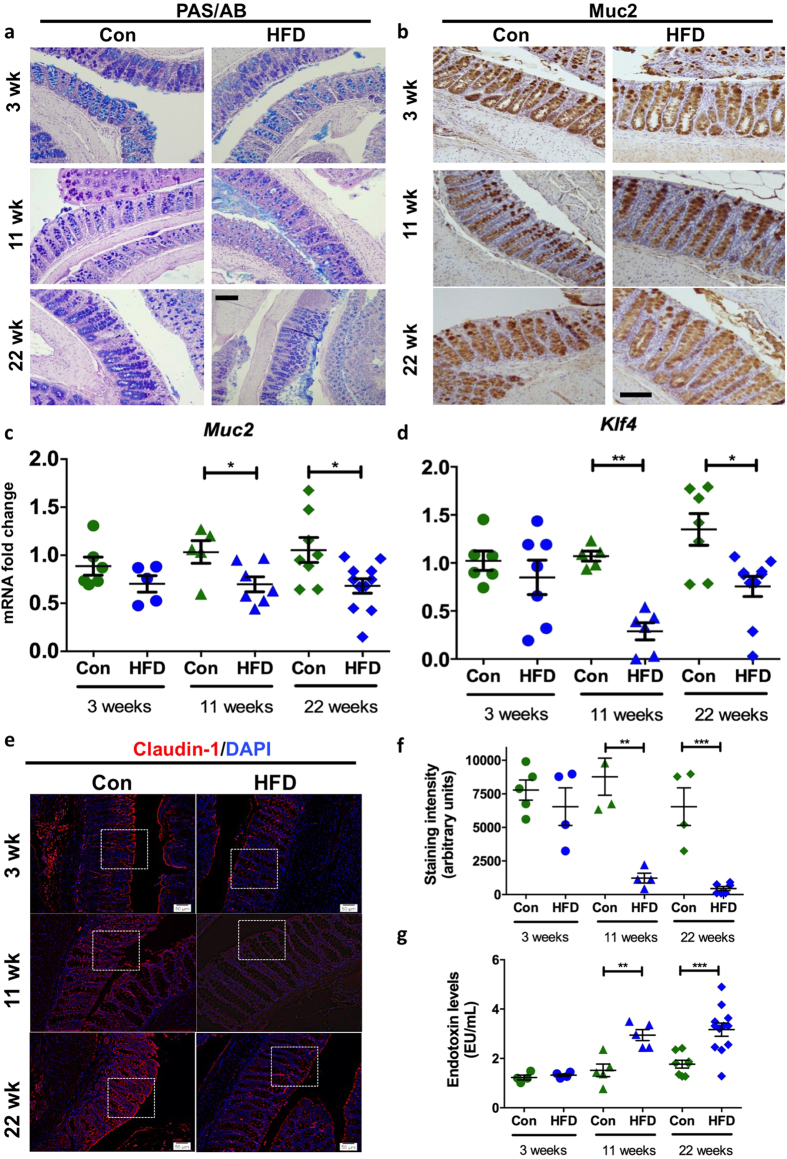
Figure 2. Wild-type C57BL/6 mice were fed a high fat diet (HFD) or normal chow diet (Con) for 3 weeks (n = 6–7 per group), 11 weeks (n = 5–6 per group) or 22 weeks (n = 8–12 per group).
(a) Periodic Acid Schiff’s-Alcian Blue and (b) mature Muc2 immunohistochemical staining shows glycoproteins within the colon in HFD versus Con mice. qRT-PCR was used to determine the colonic mRNA levels of (c) Muc2 and (d) Klf4. Normalised to mean expression of β-actin and expressed as a fold change compared to in respective control mice. (e) Immu-nofluorescence was used to determine the levels of claudin-1 (boxes highlight high-powered images shown in Supplementary Fig. 2j), (f) shows the staining intensity. (g) Serum endotoxin levels (EU/mL). Mean ± SEM. Unpaired student t test Con versus HFD for each respective experiment duration. *p < 0.05 **p < 0.01. Scale bars = 50 μM.

