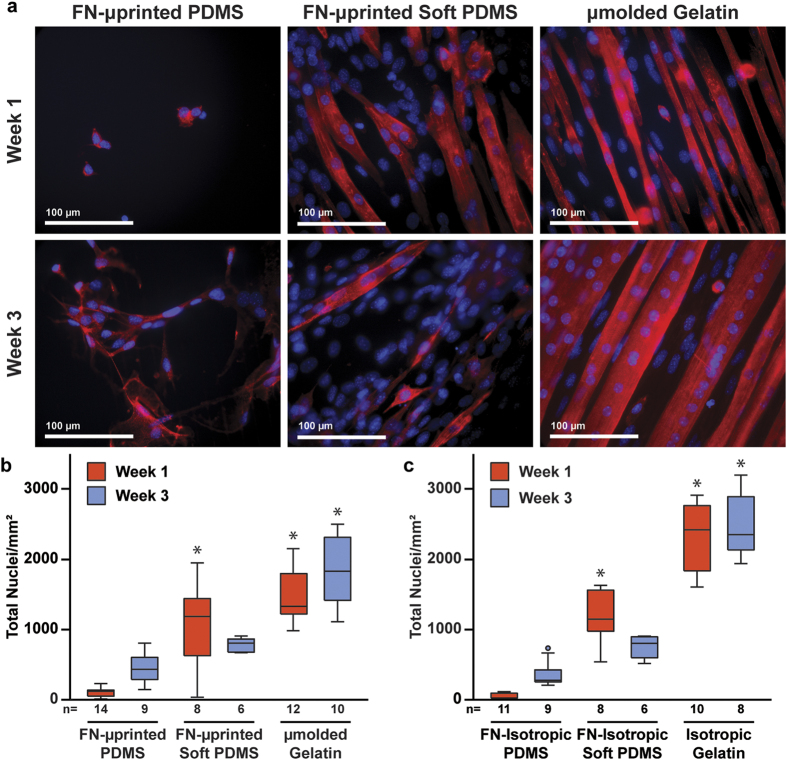
Figure 3. Cell adhesion on engineered constructs.
(a) Representative images of C2C12 skeletal myoblasts seeded and differentiated into myotubes on FN-μprinted PDMS (first column), FN-μprinted soft PDMS (second column), and μmolded gelatin hydrogels (third column). Images were collected one week (first row) and three weeks (second row) after initiating differentiation of myoblasts into myotubes. Blue: nuclei, red: sarcomeric α-actinin. Total number of nuclei present on μpatterned (b) and isotropic (c) constructs (n is indicated below each bar, *indicates statistically significant difference compared to PDMS construct at same time point, Kruskal-Wallis test followed by Tukey’s test for multiple comparisons, p < 0.05). Details of statistical analysis are located in Supplementary Tables S4 and S5.

