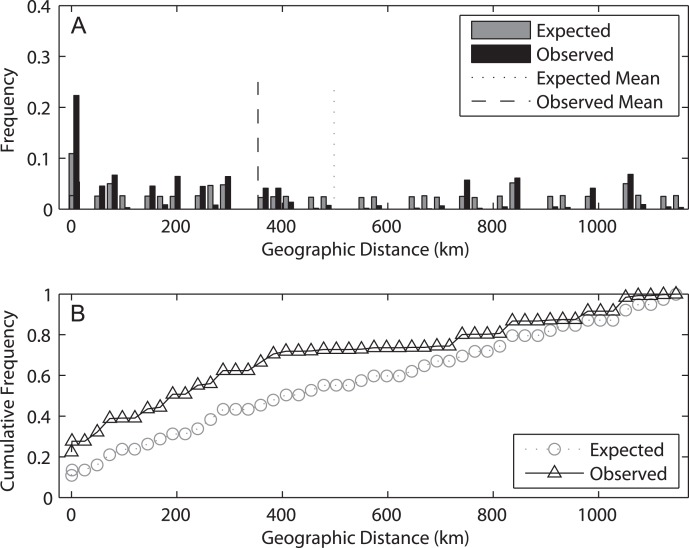
Figure 6. Results of the spatial analysis of shared alleles.
The geographic distances observed between co-occurring alleles and those expected under panmixia are given in (A) in the form of histograms and in (B) as cumulative frequency plots. The observed and expected mean distances are indicated in the upper graph.

