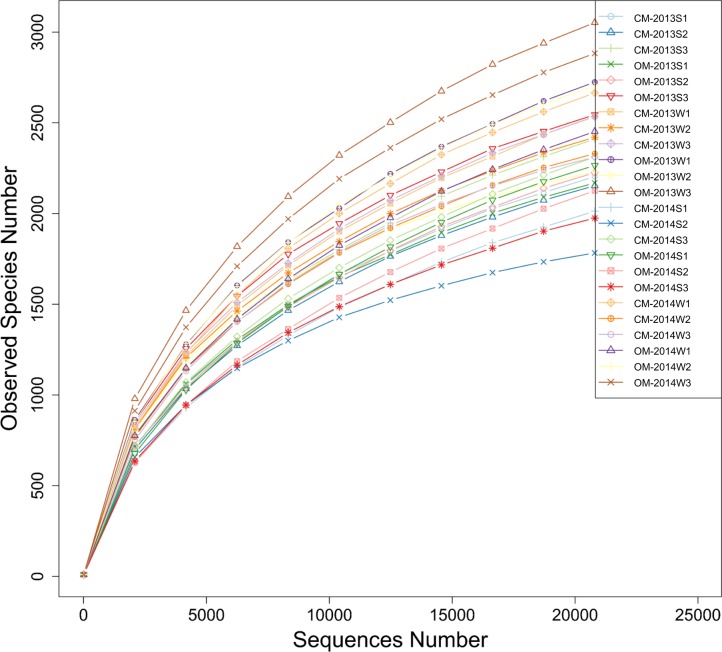
Figure 1. Rarefaction curves of observed species (i.e., OTUs) number clustered at the 3% phylogenetic distance level based on the 16S rDNA gene sequences of all soil samples derived from organic management (OM) and conventional management (CM).
“S” and “W” in the sample codes mean sampling time of summer at mid-June and winter at mid-December, respectively. Each management had three replicates.

