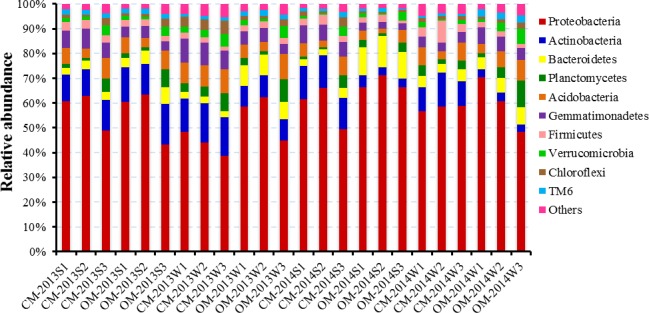
Figure 2. Relative abundance of the dominant bacterial at phylum level of soil samples derived from organic management (OM) and conventional management (CM) at summer and winter in 2013 and 2014 respectively.

“S” and “W” in the sample codes mean sampling time of summer at mid-June and winter at mid-December, respectively. Each management had three replicates.
