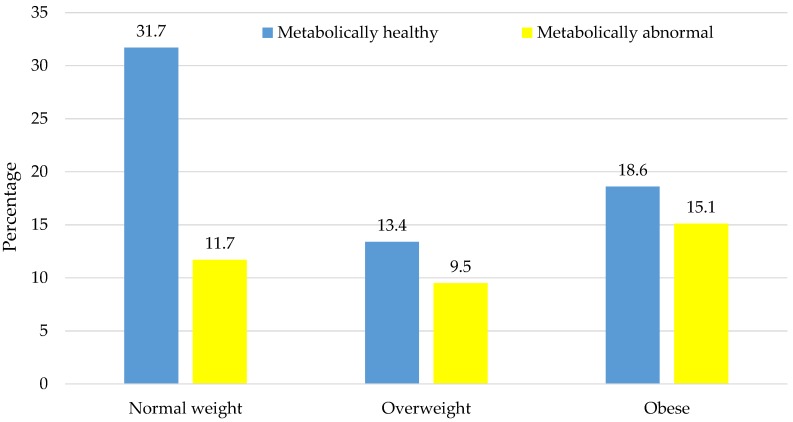
Figure 1.
Distribution of metabolic phenotypes across body mass index categories. Each vertical bar represents the proportion of participants in the total sample with the corresponding combination of body size (normal-weight, overweight, or obese) and metabolic phenotype (healthy or abnormal). The accompanying proportions are shown at the tip of each bar.

