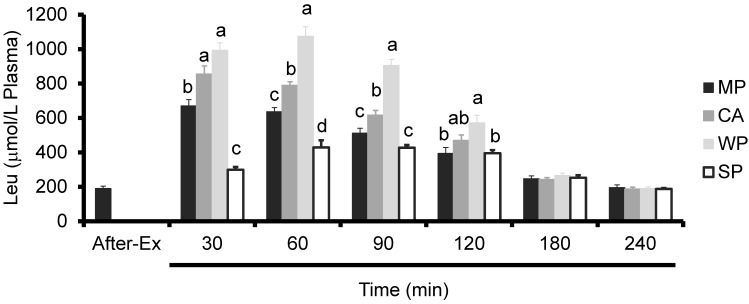
Figure 3.
Plasma leucine levels in rats administered test solutions with different protein content. Values are expressed as mean ± standard error (n = 6~8). Significant time × treatment interactions (p < 0.001) were observed. a, b, c Mean values with unlike letters are significantly different (p < 0.05; Tukey’s post-hoc analysis). MP, milk protein concentrate; CA, caseinate; WP, whey protein concentrate; SP, soy protein concentrate.

