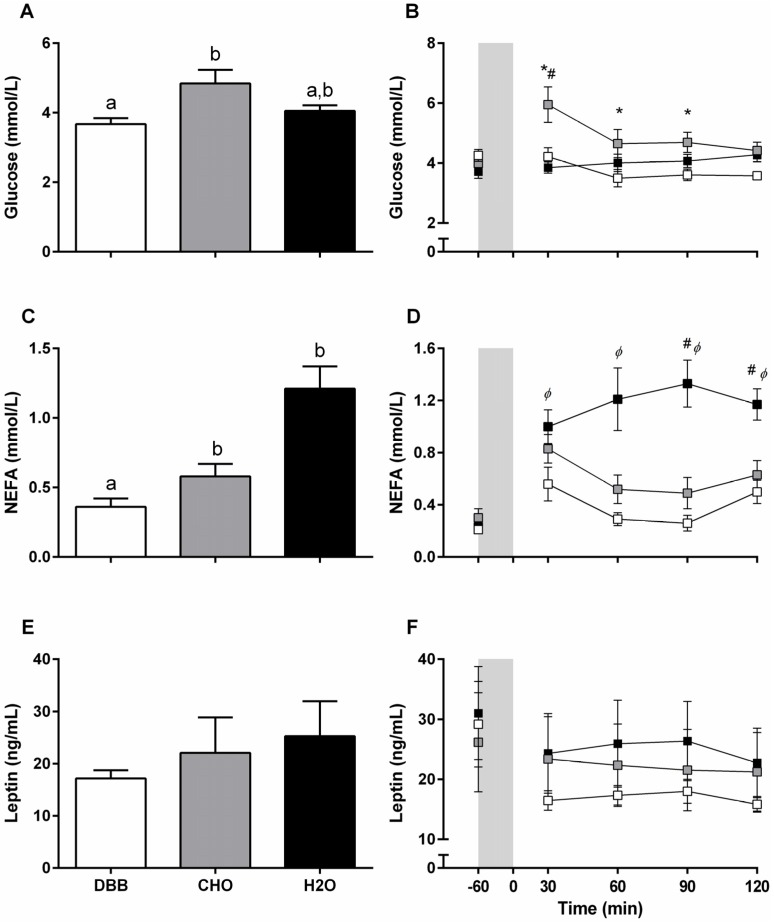
Figure 2.
Time-average (90 min) (A,C,E) and plasma concentrations (B,D,F) of glucose (mmol/L), NEFA (mmol/L), and leptin (ng/mL), respectively, pre (−60) and throughout the 120 min recovery period (n = 13). Vertical grey shaded area (B,D,F) represent the 60 min cycling bout. Values are presented as mean ± SEM. Values with unlike letters (a,b) denote significant difference between trials. White filled boxes ( ) represent DBB, grey filled boxes (
 ) represent CHO, and black filled boxes (
 ) represent H2O. Significance at the p < 0.05 level. ϕ denotes significant difference between DBB and H2O; # denotes significant difference between CHO and H2O; * denotes significant difference between DBB and CHO.

