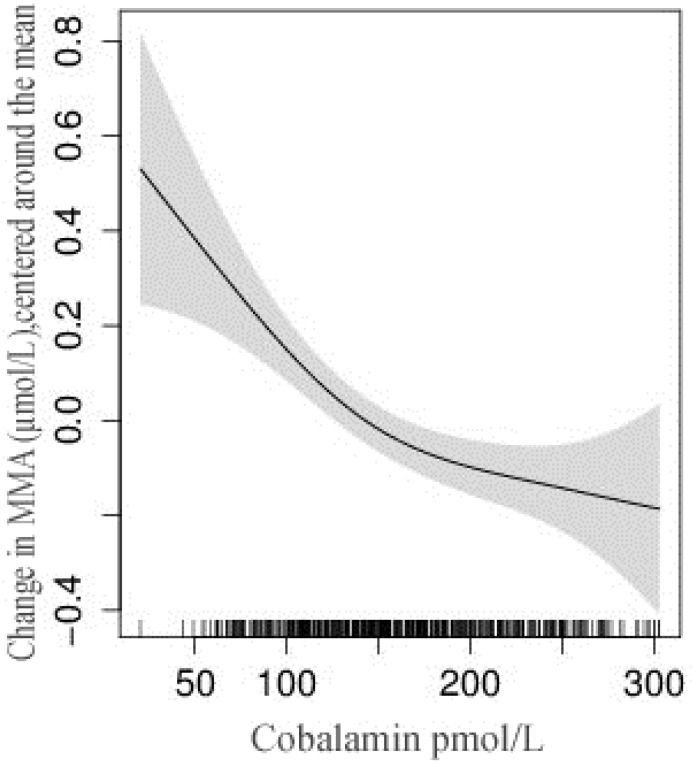
Figure 3.
Relationship between methylamalonic acid and plasma cobalamin concentration among non-pregnant women in Bhaktapur, Nepal. The vertical lines on the x-axis represent the number of subjects and the shaded area represents 95% confidence interval (CI) of the methylmalonic acid (MMA) concentration.

