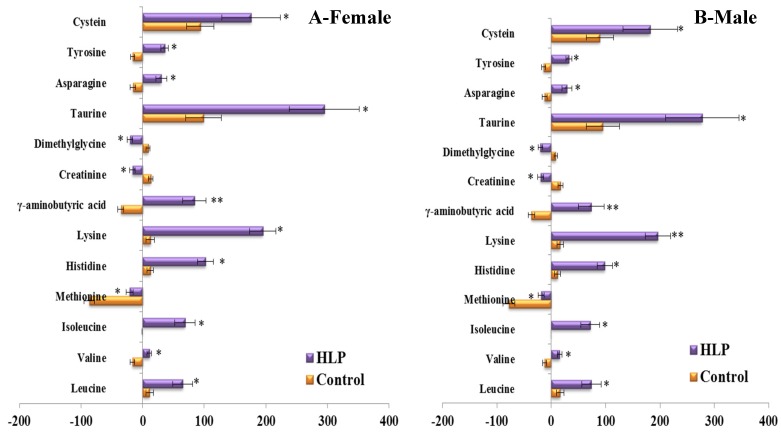
Figure 5.
Percent changes of metabolites from fasting to 2-h samples during an OGTT between female (A) and male (B) in the control (Orange) and HLP groups (Purple). Percent changes for the metabolites (X) detected by UPLC-TQ-MS were calculated as follows: XPercent change = (XConcentration at different time (120) − XConcentration at baseline)/(XConcentration at baseline). * p < 0.05, ** p < 0.01, compared with the control group using student’s t test.

