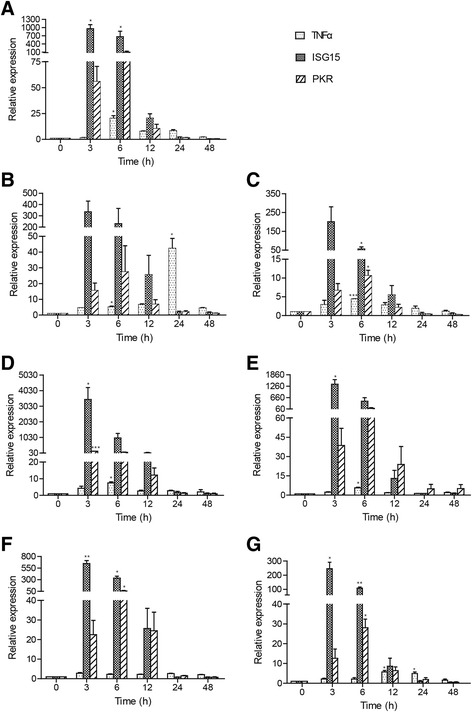
Fig. 6.

Expression analysis of ccTNFα and ccISGs in response to poly I:C challenge in vitro. Total RNA was extracted from head kidney (a), liver (b), spleen (c), gill (d), foregut (e), hindgut (f) and skin (g) of the control and challenged samples (shown in Fig. 5). The expression was normalized to S11 and shown as relative to control. The data are presented as the mean ± S.D. (n = 3). Significant values in comparison to the control are indicated by *p < 0.05, **p < 0.01 and ***p < 0.001
