Fig. 2.

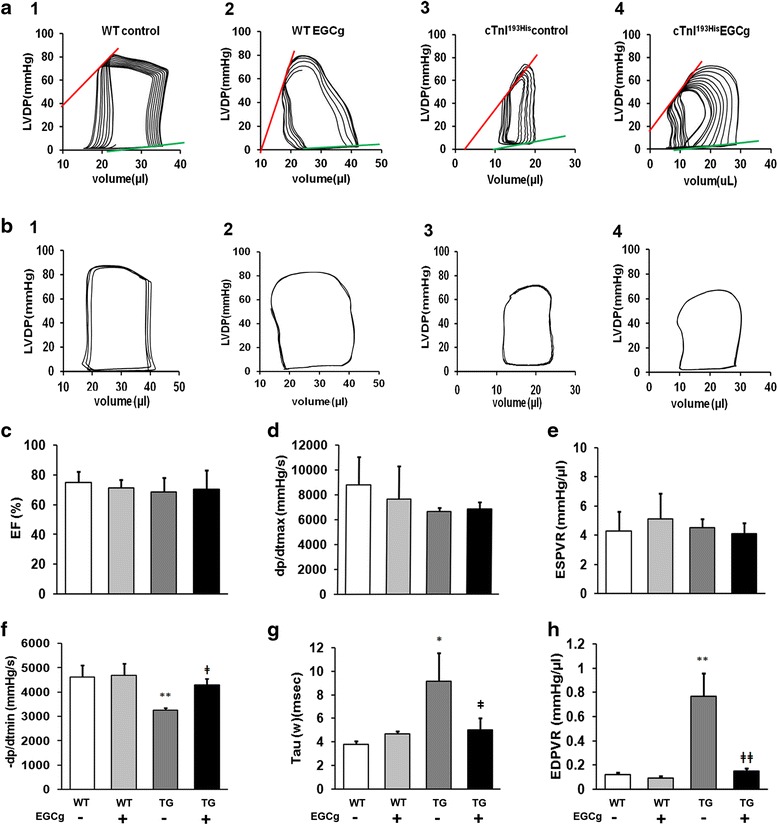
Representative pressure-volume loops obtained from catheter-based left ventricular P-V measurements in experimental mice. a Characteristic changes in left ventricular developmental pressure (LVDP) corresponding to the volume changes. Upper line indicates end systole pressure volume relationship (ESPVR) and the low line indicates end diastole pressure volume relationship (EDPVR) in different groups of mice: 1, WT mice in control group (WT control); 2, WT mice with EGCg treatment (WT EGCg); 3, cTnI193His RCM mice in control (cTnI193His control); 4, cTnI193His RCM with EGCg treatment (cTnI193His EGCg). b Normal baseline PV loops from different groups of mice. Cardiac function parameters are shown in (c), ejection fraction (EF); (d) the maximal rate of contraction (+dP/dt); (e) end-systolic pressure–volume relation slope (ESPVR); (f) the maximal rate of relaxation (−dP/dt); (g) relaxation time constant calculated by Weiss method (τ); (h) end-diastolic pressure–volume relation (EDPVR). Data are presented as means ± SE. *compared between WT and TG mice; ǂ compared between mice with or without treatment. * or ǂ P <0.05; ** or ǂǂ P<0.01
