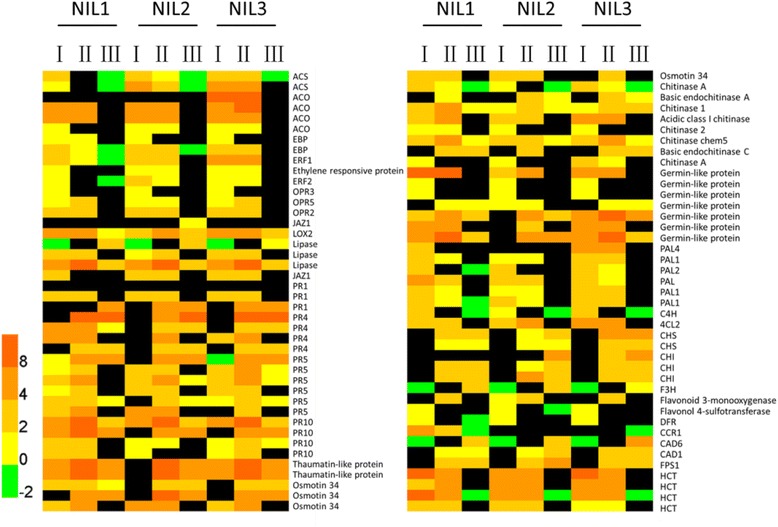
Fig. 4.

Samples of the resistance-related genes commonly upregulated in three NILs after inoculation of F. graminearum. The bottom colored scale represents the log2 of foldchange values for each gene. Black color indicates unchanged genes. The numerals I, II, and III indicated under each NIL denote a comparison between 0 and 6 hpi, 0 and 18 hpi, and 6 and 18 hpi, respectively. The function of each gene is listed to the right
