Fig. 1.

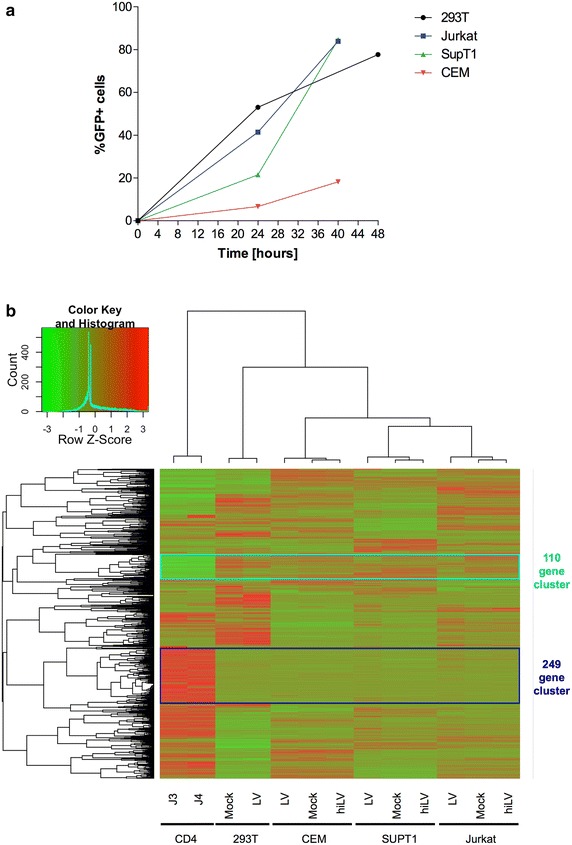
Differences between resting primary CD4+ T cells and laboratory cell lines in innate immunity. a Laboratory cell lines revealed differential permissiveness to HIV infection. Cells were infected using a VSV-G pseudotyped HIV virus. Viral infection success was assessed by FACS analysis of the expression of the virally encoded GFP reporter gene, and ranged from ~7 to 53 % according to the cell line infected. b Heatmap of expression values of innate immunity genes in resting CD4+ T cells and laboratory cell lines. The figure shows the expression values of 1473 innate immunity genes in resting CD4+ T cells from two donors (CD4_J3 and CD4_J4), and four human laboratory cell lines HEK293T, Jurkat, SupT1 and CEM. Cell lines were evaluated in 3 conditions: uninfected mock (Mock), heat-inactivated HIV vector (hiLV) and HIV vector-infected (LV). Complete hierarchical clustering of genes and cell samples was based on Pearson correlation of variance-stabilized read counts (Methods). Color scale indicated in the legend corresponds to z-scores of RPKM distributions per gene, ranging from green (low) to red (high) expression. Two prominent clusters of genes are highlighted: 249 genes with a high expression in resting CD4+ T cells and a low relative expression in all laboratory cell lines (dark blue square) and 110 genes with a low relative expression in resting CD4+ T cells and a high relative expression in all laboratory cell lines (cyan square). The genes within each of these two clusters are listed in Additional file 3: Table S2
