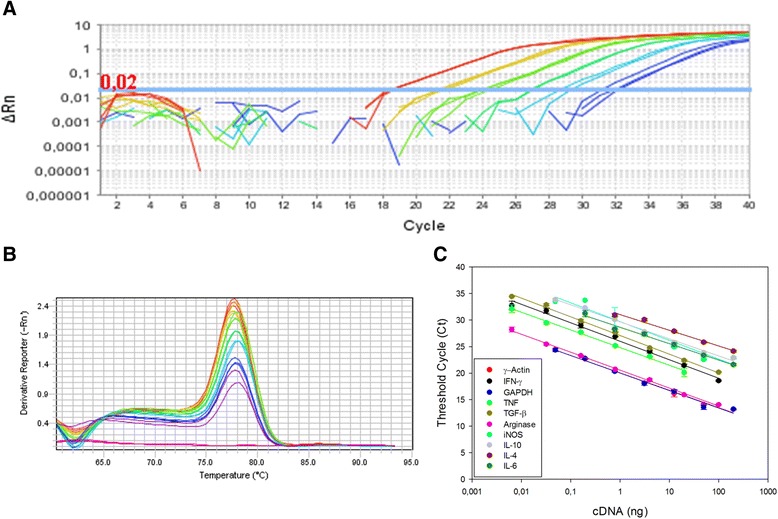
Fig. 1.

Standardization of RT-qPCR assays for gene expression analysis of immunological markers. Golden hamsters were infected with 105 Leishmania (V.) braziliensis promastigotes, for 110 days. The panel shows a representative amplification plot with the fluorescent signal magnitude (a) and melting curve indicating the reaction specificity, observed through a single peak in each curve (b). Calibration curves of γ-Actin, IFN-γ, GAPDH, TNF, TGF-β, Arginase, iNOS, IL-10, IL-4 and IL-6 target genes from golden hamster indicates the linearity of the reaction (c). RT-qPCR assays were performed using SYBR Green fluorophore, as described in Methods section
