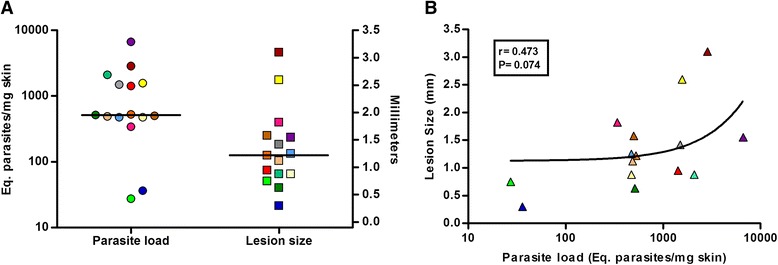
Fig. 5.

Parasite load quantitation in skin lesion of golden hamsters infected with Leishmania (V.) braziliensis. In a, the graphic shows the parasite load (circles) and lesion size (squares) of golden hamsters infected with 105 Leishmania (V.) braziliensis promastigotes, 110 days post-infection. Parasite load is expressed in parasite equivalents/hamster skin mass (mg) and lesion size is expressed in millimeters. The horizontal lines represent the median between the values. In b, the graphic shows the Spearman correlation between parasite load and lesion size. The r and P values are indicated in the graphic. Each animal is represented by a different colour in the graphics (n = 15)
