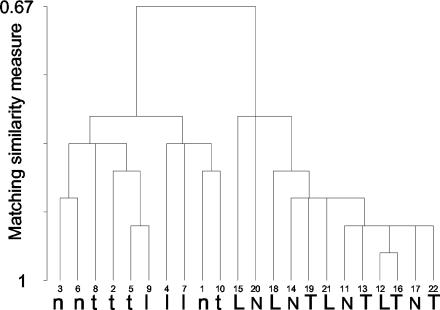
FIG. 7.
Hierarchical cluster analysis (using matching binary similarity distances and the single linkage method) of the tfdA-like SSCP banding patterns shown in Fig. 5B. N, L, and T, replicate sample lanes from nonplanted, L. perenne-planted, and T. pratense-planted soils, respectively. Lowercase letters, non-2,4-D-exposed samples; capital letters, 2,4-D-exposed samples.

