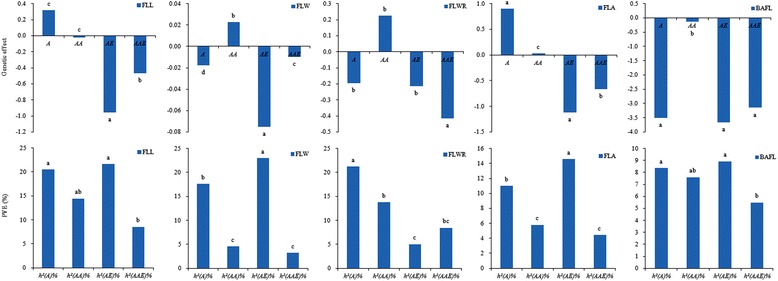
Fig. 2.

Genetic effects and phenotypic variation explained (PVE) by genetic components for traits related to flag leaf morphology of main shoots in wheat RIL population across four environments. A, AA, AE and AAE mean additive effect, epistatic effect, additive QTL × environment interaction effect and epistatic QTL × environment interaction effect, respectively; h 2(A), h 2(AA), h 2(AE) and h 2(AAE) represent phenotypic variation explained (PVE) by A, AA, AE and AAE, respectively. Different lowercase letters indicate significant differences (P < 0.05) between genetic components for each trait
