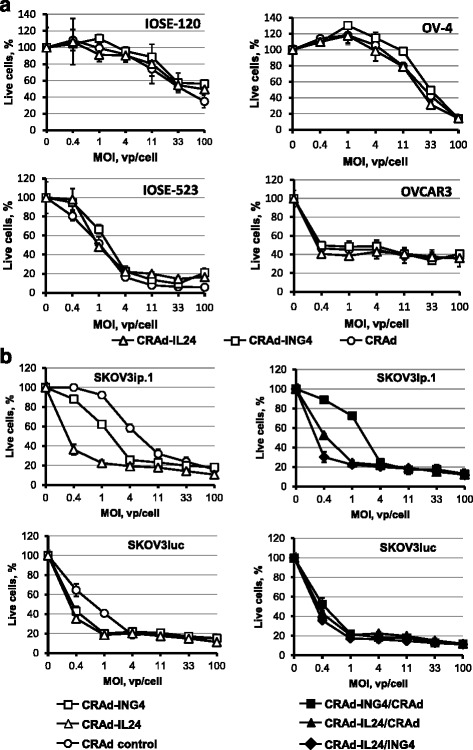
Fig. 5.

Analysis of cytotoxic CRAd effects in normal and OvCa cells. a) The monolayers of normal ovarian surface epithelial IOSE-120 and IOSE-523 cells or OV-4 and OVCAR3 OvCa cells were infected with each CRAd vector at the indicated MOIs (vp/cell). b) The monolayers SKOV3ip.1 and SKOV3luc OvCa cells were infected with each CRAd alone (left panel) or two CRAd vectors together (right panel) at the indicated MOIs (vp/cell). The infected and uninfected cells were stained using MTS-based Cell Proliferation Assay (Promega) 6 days postinfection to detect cells that survived CRAd CPE. Live cells percentages are calculated with respect to mock-infected cell monolayers.. Each data point represents the cumulative mean ± SD (some error bars are smaller than the symbols, p ≤ 0.05)
