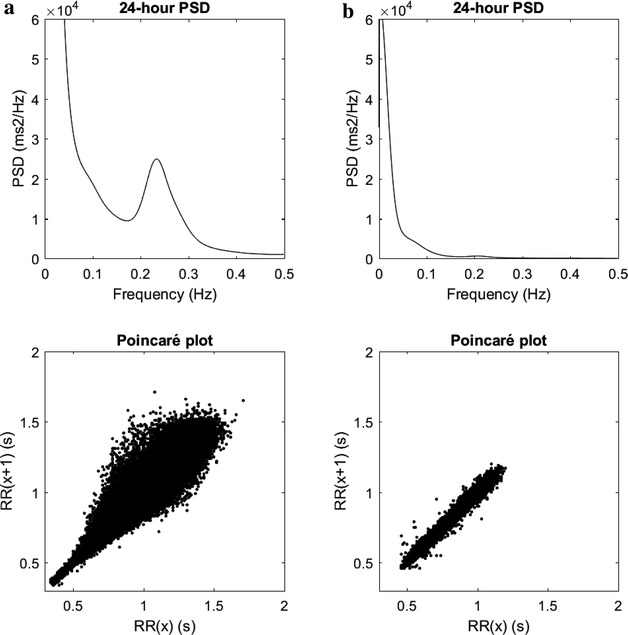
Fig. 1.

Long-term heart rate variability (HRV) using 24-h ECG recordings in two subjects where the subject to the right (a control) presented higher heart rate variability compared to the subject shown to the left (b). Top panels show the total average power spectrum and the bottom panels show Poincaré plots where each point shows the relation between two subsequent RR intervals. 24 h PSD = average power spectral density over 24-h, RR(x) = “current” RRinterval, RR(x−1) = previous RR-interval
