

Abstract
Background
A high amount of sedentary time has been proposed as a risk factor for various health outcomes in adults. While the evidence is less clear in children and adolescents, monitoring sedentary time is important to understand the prevalence rates and how this behaviour varies over time and by place. This systematic literature review aims to provide an overview of existing cross-European studies on sedentary time in children (0-12y) and adolescents (13-18y), to describe the variation in population levels of sedentary time, and to discuss the impact of assessment methods.
Methods
Six literature databases were searched (PubMed, EMBASE, CINAHL, PsycINFO, SportDiscus and OpenGrey), followed by backward- and forward tracking and searching authors’ and experts’ literature databases. Included articles were observational studies reporting on levels of sedentary time in the general population of children and/or adolescents in at least two European countries. Population levels were reported separately for children and adolescents. Data were reviewed, extracted and assessed by two researchers, with disagreements being resolved by a third researcher. The review protocol is published under registration number CRD42014013379 in the PROSPERO database.
Results
Forty-two eligible articles were identified, most were cross-sectional (n = 38). The number of included European countries per article ranged from 2 to 36. Levels of sedentary time were observed to be higher in East-European countries compared to the rest of Europe. There was a large variation in assessment methods and reported outcome variables. The majority of articles used a child-specific questionnaire (60 %). Other methods included accelerometers, parental questionnaires or interviews and ecological momentary assessment tools. Television time was reported as outcome variable in 57 % of included articles (ranging from a mean value of 1 h to 2.7 h in children and 1.3 h to 4.4 h in adolescents), total sedentary time in 24 % (ranging from a mean value of 192 min to 552 min in children and from 268 min to 506 min in adolescents).
Conclusion
A substantial number of published studies report on levels of sedentary time in children and adolescents across European countries, but there was a large variation in assessment methods. Questionnaires (child specific) were used most often, but they mostly measured specific screen-based activities and did not assess total sedentary time. There is a need for harmonisation and standardisation of objective and subjective methods to assess sedentary time in children and adolescents to enable comparison across countries.
Electronic supplementary material
The online version of this article (doi:10.1186/s12966-016-0395-5) contains supplementary material, which is available to authorized users.
Keywords: Youth, Prevalence, Assessment method, Health behaviour, Europe
Background
Sedentary behaviour is defined as “any waking behaviour characterised by an energy expenditure of ≤ 1.5 metabolic equivalents while in a sitting or reclining position” [1]. The time spent in those sedentary behaviours has been defined as sedentary time. Although there is debate on the association between sedentary time and health outcomes in adults [2, 3], there are several studies, systematic reviews and meta-analyses showing that sedentary time has been positively associated with type 2 diabetes, cardiovascular diseases, metabolic syndrome and all-cause mortality among adults, independently from moderate to vigorous physical activity or subcomponents of physical activity [4–9]. Among children and adolescents, the evidence is less conclusive [10–12]. A possible reason is that some of the health outcomes may not be easily manifested in childhood or adolescence [10]. However, a recent review of reviews has suggested that there is an association between children’s screen-time behaviours (i.e. domain-specific sedentary behaviours) and obesity, blood pressure, total cholesterol, self-esteem, social behaviour problems, physical fitness and academic achievement [4]. Moreover, since sedentary time in early life may track into adulthood where it may have potential health implications and since children and adolescents spend a lot of time sedentary [13], actions may be considered to reduce time spent sedentary in children and adolescents. An important step to guide targeted action is to monitor the levels of sedentary time among children and adolescents across countries. This step is needed to study how the mean population levels of sedentary time vary by place, how it changes over time, and to evaluate preventive strategies and policies. In addition, it would be relevant to study and monitor the population levels of sedentary time specifically in Europe as it has its own governing structures but also a wide range of different cultures. Although the countries within Europe are diverse regarding political, economic, (socio-)cultural and physical environmental contexts, they are currently all struggling with an alarming increase in lifestyle related diseases such as overweight and obesity. This means that more effective efforts to reduce sedentary time in Europe are needed and monitoring the behaviour is a first step to address this need [14]. Focusing on specific European evidence is important to formulate public health guidelines and policy recommendations at the appropriate European level.
The DEDIPAC (DEterminants of DIet and Physical ACtivity) Knowledge Hub was established in 2013 by twelve European Union Member States [14]. One of the aims of DEDIPAC is “to enable a better standardised and more continuous cross-European monitoring of behaviours (including sedentary time) and changes in these behaviours across the life course and within populations to identify both targets and target populations for (policy) interventions”. A first and crucial step within DEDIPAC towards standardisation and harmonisation is to provide an overview of existing cross-European surveillance studies in order to describe population levels of (un)healthy behaviour by conjointly performing four systematic literature reviews. The reason to focus on cross-European studies is based on a 2010 WHO report concluding that even though population levels of health behaviour are frequently monitored across Europe, national surveys are not comparable due to differences in assessment methods [15]. Thus, focusing on cross-European initiatives at least enables within-study country comparison.
Therefore, this systematic literature review aims (a) to provide an overview of the existing cross-European studies (including data of at least two European countries) on sedentary time in children, (b) to describe the variation in population levels of sedentary time in European children and adolescents (0-18 years) according to these studies, and (c) to discuss the impact of assessment methods used. The other three reviews focus on the population levels of (1) sedentary time in adults [16], (2) physical activity in adults [17], and (3) physical activity in youth [18].
Methods
As described in the introduction, this systematic literature review is part of a set of four reviews. Because the four systematic reviews originate from the same project, have similar objectives (although for different behaviours and/or age groups) and share their methodology, the introduction, methods and discussion sections of the review articles have obvious similarities. The search, article selection, data extraction and quality assessment were conducted conjointly for all four reviews. Subsequently, the included articles were allocated to the appropriate review article(s). If an article included both youth (<18 years) and adults (≥18 years) and presented stratified results, those stratified results were used in the appropriate review. If the article did not present stratified results, the article was allocated to the most appropriate review, based on the mean age (and age distribution) of the study sample. One article could be included in multiple reviews. Before the search commenced, review protocols were written based on the “Centre for Reviews and Dissemination’s guidance for undertaking reviews in health care” [19], and registered in the PROSPERO database (http://www.crd.york.ac.uk/PROSPERO/). The review protocol on sedentary time in youth is published under registration number CRD42014013379. The reporting of this systematic review adheres to the preferred reporting items of the PRISMA-P checklist (see Additional file 1).
Search strategy
The search was conducted in June 2014 and updated on the 29th of February, 2016. Six databases (PubMed, EMBASE, CINAHL, PsycINFO, SportDiscus and OpenGrey) were searched using similar search strategies, adapted to each database. The following search terms were used: ‘Physical activity’ OR ‘Sedentary behaviour’ AND ‘Europe’ (including all individual country names) AND ‘Countries‘/’Multicountry’/’International’. Both the index terms and the title and abstract were searched and synonyms (e.g. for sedentary behaviour: sitting, screen time, etc.) were used. The complete search string can be found in Additional file 2. Based on the in- and exclusion criteria described below, search filters of the databases were used when possible, for example to select the appropriate publication period or language. In addition, complementary search strategies were used. After the full-text review phase, the reference lists of the included articles were scanned (backward tracking) and a citation search was performed for the included articles (forward tracking) to identify potentially appropriate articles. Also, several experts in the field of physical activity and sedentary time were contacted to provide additional articles. Finally, all authors involved in the four reviews were asked to search their own literature databases for appropriate articles. All additionally retrieved articles underwent the same selection process as the original articles - as described below.
Article selection
All retrieved records were imported into Reference Manager 12 (Thomson Reuters, New York). Duplicates were hand-searched and removed. Records were included if they were journal articles, reports or doctoral dissertations (further referred to as ‘articles’) written in English. To be included, articles needed to report on observational studies conducted after 01-01-2000 in the general, healthy population. This was done to avoid the reporting of outdated data. In addition, articles were only included if they provided data for two or more European countries (as defined by the Council of Europe) [20]. Articles were included if they reported total sedentary time (e.g. minutes/day), time spent sitting at school, time spent on screen-time behaviours (e.g. television viewing, using a computer) and/or time spent at any other sedentary activity. Both subjective (e.g. questionnaires) and objective (e.g. accelerometers) measures were included.
Three researchers (AL, LVH, MV) were involved in the article selection, data extraction and quality assessment. For the title selection, the three researchers each independently reviewed 1/3 of the titles of the retrieved articles. For the abstract and the full-text selection, data extraction and quality assessment, the three researchers each covered 2/3 of the articles, so that each article was independently reviewed, extracted and assessed by two different researchers. Disagreement between the two researchers was resolved by the third researcher.
Data extraction
A standardised data extraction file was used to extract data regarding the study characteristics, study sample, assessment methods, reported outcomes, and findings. We did not obtain the original data. The complete data extraction file can be found in Additional file 3. To present the data more clearly and to allow for comparisons between age groups, the results are presented and discussed separately for children (aged 0-12 years) and adolescents (aged 13-18 years).
Quality assessment
A quality score was used to provide a general overview of the quality of the included articles. The ‘Standard quality assessment criteria for evaluating primary research papers from a variety of fields’ was used for the assessment [21]. The checklist consists of fourteen items to be scored ‘Yes’ (2 points), ‘Partial’ (1 point), ‘No’ (0 points) and ‘Not applicable’. The summary score was calculated as follows: Total sum ((number of ‘Yes’ x 2) + (number of ‘Partial’ x 1))/Total possible sum (28 – (number of ‘Not applicable’ x 2)). This instrument was chosen because it provides the opportunity to assess and compare the quality of different study designs, focuses on both the research and the reporting, and allows researchers to indicate that an item is not applicable, without affecting the total quality score. The complete quality assessment file can be found in Additional file 4.
Results
Overview of the existing cross-European studies on sedentary time in children
The search resulted in 9756 articles, after duplicates were removed. Based on titles and abstracts, the full text of 581 potentially relevant articles was retrieved and reviewed. This resulted in a total of 80 articles, of which 42 reported on levels of sedentary time in children and/or adolescents (Fig. 1) [22–63]. Table 1 provides an overview of the characteristics of the included articles. In brief, most articles were cross-sectional (n = 38), the quality score ranged from 0.64 to 1.0 on a scale from 0 to 1, the number of included European countries ranged from 2 to 36, and sample size ranged from 503 to 443,821. The majority of articles (n = 37) were part of a larger European study, that is the COSI study (1 article), ENERGY (6 articles), EYHS (5 articles), HBSC 01/02 (5 articles), HBSC 05/06 (3 articles), HBSC 09/10 (2 articles), HBSC 13/14 (1 article), ICAD (3 articles), IDEFICS (3 articles), ISAAC (1 article), ISCOLE (2 articles), Pro Children (2 articles), and Toybox (2 articles). One study reported data of HBSC 01/02, 05/06 and 09/10 together [49], which makes it possible to look at trends in sedentary time over time. Therefore, to describe the variation in population levels of sedentary time, we did not include all articles. If there was more than one article within a larger study reporting exactly the same outcome variable in a similar way in the same sample, only one article was included. These studies included data of all European countries, except for Andorra, Azerbaijan, Bosnia and Herzegovina, Georgia, Liechtenstein, Monaco, Montenegro, San Marino and Serbia.
Fig. 1.
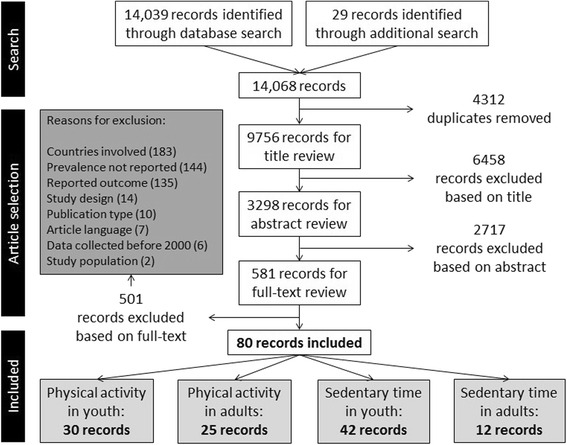
Flowchart of the combined review process
Table 1.
Study information and sample characteristics of the articles included in the systematic review
| Publication | Study | Study design | Quality score (0-1) | Number of EU countries | Number of EU partici-pants | Demographics | Sedentary time assessment method | Reported sedentary time variable | |||
|---|---|---|---|---|---|---|---|---|---|---|---|
| Age range | Gender, girls | SES | Weight status | ||||||||
| Biddle et al. (2009) a [ 22 ] | / | CS | 0.91 | 3 | 623 | 13-18y | 60.4 % | 15.0 - 36.1 % low SES | n.r. | Ecological Momentary Assessment diary | min/weekday and min/weekend day technical sedentary behaviours, social sedentary behaviours |
| Soos et al. (2012) [23] | / | CS | 0.83 | 2 | 635 | 13.1-18.0y | 60.5 % | n.r. | n.r. | Ecological Momentary Assessment diary | min/day television viewing, doing homework, motorised transport, sitting and talking, computer use, reading, sitting doing nothing, videogames |
| Soos et al. (2014) [ 24 ] | / | CS | 0.86 | 4 | 700 | 11.9-17.9y | 57 % | n.r. | n.r. | Ecological Momentary Assessment diary | min/day television viewing, computer use, playing computer games, telephone use, motorised transport, sitting and talking, doing homework, reading |
| Cinar & Murtomaa (2008) a [ 25 ] | / | CS | 0.77 | 2 | 619 | 10-12y | 43.9 - 49.1 % | n.r. | 18.7 kg/m2 | Child questionnaire | % favorable: <2 h/day television viewing % unfavorable: >2 h/day television viewing |
| Hanewinkel et al. (2012) [ 26 ] | / | CS | 0.95 | 6 | 16551 | 10-19y | 49 % | 10 % low SES | n.r. | Child questionnaire | h/schoolday television viewing: % None, % less than 1 h, % 1–2 h, % 3–4 h, % >4 h |
| Börnhorst et al. (2015) [ 27 ] | COSI | CS | 0.95 | 5 | 10453 | 6.0-9.9y | 49.4 % | 16.5 % par. Master’s degree or higher | 26.9 % over-weight | Child questionnaire | h/day television time, computer time, screen-time |
| Brug et al. (2012) a [ 28 ] | ENERGY | CS | 1.00 | 7 | 7234 | 10-12y | 52 % | 15.7-48.4 % low par. edu. | 18.1 - 20.6 kg/m2 | Child questionnaire | min/day screen-time, television viewing and computer use (FQ and 24 h-recall) |
| Brug et al. (2012)a [29] | ENERGY | CS | 0.91 | 7 | 7307 | 10-12y | 52 % | 29-59 % low par. edu. | 19.0-19.5 kg/m2 | Child questionnaire | min/day screen-time |
| Fernandez-Alvira et al. (2013) [30] | ENERGY | CS | 0.95 | 7 | 5284 | 10-12y | 54.3 % | 32.5 % low par. edu. | 20.4 % over-weight | Child questionnaire | min/day screen-time |
| van Stralen et al. (2014) [ 31 ] | ENERGY | CS | 0.95 | 5 | 1025 | 10-12y | 51 % | 45 % low par. edu. | 19.0 kg/m2 | ActiGraph accelerometer | min/school-time sedentary time + percentage of total school-time spent in sedentary activities |
| Verloigne et al. (2012) [ 32 ] | ENERGY | CS | 0.95 | 5 | 687 | 10-12y | 53 % | n.r. | 19.0 kg/m2 | ActiGraph accelerometer | min/day sedentary time |
| Yildirim et al. (2014) [33] | ENERGY | CS | 0.95 | 5 | 722 | 10-12y | 53 % | 14 % not speaking native language at home | n.r. | ActiGraph accelerometer | min/day sedentary time |
| Ekelund et al. (2004) [34] | EYHS | CS | 1.00 | 4 | 1292 | 9-10y | 50.6 % | n.r. | 17.2 kg/m2 | MTI ActiGraph accelerometer | % sedentary activity per day |
| Jago et al. (2008) [35] | EYHS | CS | 0.95 | 4 | 2670 | 9y and 15y | 51.1 % | n.r. | 13.1 % over-weight | Child questionnaire | % <2 h, % ≥2 h television viewing after school % <1 h, % ≥1 h/day computer use |
| Nilsson et al. (2009) a [ 36 ] | EYHS | CS | 1.00 | 4 | 1954 | 9y and 15y | 47.9 – 63.2 % | n.r. | n.r. | MTI ActiGraph accelerometer | min/weekday, min/weekend day, min/school-time, min/leisure-time sedentary time |
| Ortega et al. (2013) a [ 37 ] | EYHS | LT cohort | 0.91 | 2 | 503 | 15y and 18y | 55.4-56.7 % | 27.6-33.3 % mother university (baseline) | 16.4 – 17.3 kg/m2 (base-line) | ActiGraph accelerometer | min/day, weekday and weekend day sedentary time |
| van Sluijs et al. (2008) a [ 38 ] | EYHS | CS | 0.95 | 4 | 2107 | 9y and 15y | 43.9-54.4 % | 6.7-10.8 mean edu./income (3-16) | 18.1-19.2 kg/m2 | Child questionnaire | % >1 h television before school % >2 h television after school % >1 h/day computer use |
| Janssen et al. (2005) a [ 39 ] | HBSC 01/02 | CS | 0.95 | 29 | 128845 | 10-16y | 47.1 - 53.3 % | n.r. | 5.1 - 25.4 % over-weight | Child questionnaire | % high television viewing = >3 h/weekday % high computer use = >2 h/weekday |
| Kuntsche et al. (2006) [40] | HBSC 01/02 | CS | 0.91 | 5 | 19877 | 11y, 13y, 15y | 52.6 % | n.r. | n.r. | Child questionnaire | h/weekday and h/weekend day television viewing |
| Richter et al. (2009)a [41] | HBSC 01/02 | CS | 0.95 | 24 | 76794 | 13y, 15y | 52.2 % | 22.7-41.9 % low FAS | n.r. | Child questionnaire | % ≥ 4 h/day television viewing |
| Vereecken et al. (2006) [42] | HBSC 01/02 | CS | 0.91 | 28 | 148150 | 11y, 13y, 15y | n.r. | n.r. | n.r. | Child questionnaire | h/day television viewing |
| HBSC report 2004a [43] | HBSC 01/02 | CS | 0.73 | 28 | 146368 | 11y, 13y, 15y | 51.5 % | 27.6 % low FAS | 7.1 – 12.1 % pre-obese | Child questionnaire | % ≥4 h/weekday and weekend day television viewing % ≥3 h/weekday and weekend day computer use % ≥3 h/weekday and weekend day homework |
| Haug et al. (2009) a [ 44 ] | HBSC 05/06 | CS | 1.00 | 34 | 187657 | 11y, 13y, 15y | 49.3 % | n.r. | 6.3 – 18.5 % pre-obese | Child questionnaire | % less than 2 h/day television viewing, computer games, computer use |
| Torsheim et al. (2010) [45] | HBSC 05/06 | CS | 0.91 | 5 | 31022 (all 6 countries) | 11y, 13y, 15y | n.r. | n.r. | n.r. | Child questionnaire | h/day of computer use, computer games, television viewing |
| HBSC report 2008a [46] | HBSC 05/06 | CS | 0.68 | 35 | 188147 | 11y, 13y, 15y | 50.7 % | 2-70 % low FAS | 13-14 % over-weight | Child questionnaire | % ≥2 h/weekday television viewing, computer use, computer games/game console |
| Nuutinen et al. (2015) [47] | HBSC 09/10 | CS | 1.00 | 3 | 5402 | 15y | 53 % | n.r. | n.r. | Child questionnaire | h:min/day computer use schooldays |
| HBSC report 2012a [48] | HBSC 09/10 | CS | 0.68 | 35 | 178531 | 11y, 13y, 15y | 51 % | 2 %-42 % low FAS | 10-18 % over-weight | Child questionnaire | % ≥ 2 h/weekday of television viewing |
| Bucksch et al. (2016) a [ 49 ] | HBSC 01/02, HBSC 05/06, HBSC 09/10 | CS | 0.82 | 24 | 443821 (total sample) | 11y, 13y, 15y | 51.2-51.4 % | n.r. | n.r. | Child questionnaire | h/weekday and weekend day television viewing, computer use |
| (total sample) | |||||||||||
| HBSC report 2016 a [ 50 ] | HBSC 13/14 | CS | 0.64 | 36 | 199316 | 11y, 13y, 15y | 50.7 % | 38-76 FAS score (0-100) | 15 % over-weight | Child questionnaire | % ≥ 2 h/weekday of television viewing % ≥ 2 h/weekday of computer use ≥2 h/weekday of playing games |
| Atkin et al. (2014) a [ 51 ] | ICAD | Pooled data (CS and LT) | 0.82 | 5 | 5474 | 8-17y | 48.9-56.7 % | 4.8-52.6 % mother university | 9.4-24.0 % over-weight | Child or parental questionnaire | % ≥ 2/day screen time |
| Ekelund et al. (2012) a [ 52 ] | ICAD | Pooled data (CS and LT) | 0.91 | 7 | 15614 | 4-18y | 51.6 % | n.r. | 19.1-19.4 kg/m2 | ActiGraph accelerometer | min/day sedentary time |
| Hildebrand et al. (2015) [53] | ICAD | Pooled data (CS and LT) | 0.91 | 6 | 10367 | 6-18y | 53 % | n.r. | 15.9 % over-weight; 4.8 % obese | ActiGraph accelerometer | min/day sedentary time |
| Hense et al. (2011) [ 54 ] | IDEFICS | CS | 0.91 | 8 | 8542 | 2-9y | 49.2 % | 27.2 % low SES | 20.2 % over-weight | Parental questionnaire | h/day screen-time. % not at all, % <0.5 h, % 0.5-1 h, % 1-2 h, % 2-3 h, % >3 h |
| Hunsberger et al. (2012)a [55] | IDEFICS | CS | 0.86 | 8 | 12720 | 2-9y | 47.7-51.4 % | 1.2 – 30.8 % low edu. household | 7.7 – 41.9 % over-weight | Parental questionnaire | % <1 h/day screen-time |
| Kovàcs et al. (2015) [56] | IDEFICS | CS | 0.95 | 16 | 16228 | 2-9.9y | 49.1 % | 10.7 % low edu. level | Mean BMI z-score: 0.33 | Parental questionnaire | % <1 h/day screen-time (pre-schoolers) % <2 h/day screen-time (school children) |
| Mitchell et al. (2013) [ 57 ] | ISAAC | CS | 0.86 | 6-7y: 6 | 6-7ys: 33901 | 6-7y and 13-14y | n.r. | n.r. | n.r. | Child questionnaire | h/day television viewing: % < 1 h, % 1-3 h, % 3-5 h, % > 5 h |
| 13-14y: 7 | 13-14y: 61954 | ||||||||||
| Katzmaryk et al. (2015)a [58] | ISCOLE | CS | 0.95 | 3 | 1664 | 9-11y | 53.8-55.9 % | n.r. | 17.7-19.5 kg/m2 | ActiGraph accelerometer | min/day sedentary time |
| LeBlanc et al. (2015) a [ 59 ] | ISCOLE | CS | 0.95 | 3 | 1496 | 9-11y | 53.1-57.2 % | 21.1-73.2 % high par. edu. | 24.3-45.7 % over-weight | ActiGraph accelerometer and child questionnaire | h/day sedentary time h/day screen-time % ≥ 2 h/day of screen-time |
| Klepp et al. (2007) a [ 60 ] | Pro Children | CS | 1.00 | 9 | 12773 | 8.8-13.8y | 49.8 % | 71.6 - 82.1 % not in social class I-II | n.r. | Child questionnaire | h/day television viewing |
| te Velde et al. (2007) [ 61 ] | Pro Children | CS | 0.95 | 9 | 12538 | 8.8-13.8y | 50.1 % | n.r. | n.r. | Child questionnaire | % <2 h/day television viewing % >1 h/day computer use |
| De Craemer et al. (2015) [ 62 ] | Toybox | CS | 0.95 | 6 | 8117 | 3.5-5.5y | 47 % | n.r. | n.r. | Parental questionnaire | min/weekday and weekend day television viewing, computer use, quiet play % <1 h/day screen-time weekday and weekend day |
| van Stralen et al. (2012) a [ 63 ] | ToyBox | Pooled data (CS) | 0.91 | 5 | 6097 | 4-7y | 47.4 - 52.0 % | n.r. | 15.9 – 16.8 kg/m2 | Parental questionnaire | h/day television viewing, % ≥ 2 h/day of television viewing, h/day screen-time, min/day sedentary time (sedentary play-time + screen-time) |
COSI WHO European Childhood Obesity Surveillance Initiative, ENERGY EuropeaN Energy balance Research to prevent excessive weight Gain among Youth, EYHS European Youth Heart Study, HBSC Health Behaviour in School-aged Children, ICAD International Children’s Accelerometer Database, IDEFICS Identification and prevention of Dietary and lifestyle induced health Effects In Children and infantS, ISAAC International Study of Asthma and Allergies in Childhood, ISCOLE The International Study of Childhood Obesity, Lifestyle and the Environment, CS cross-sectional, LT longitudinal, n.r. not reported, SES socio-economic status, par. edu. parental education, inc. income, FAS Family Affluence Scale, FQ frequency question, aThese articles only presented stratified demographics, so the range is reported; articles in bold were included in Tables 2 and 3
Variation in population levels of sedentary time in European children and adolescents
The population levels of sedentary time in children (0-12y) and adolescents (13-18y) are presented by country in Tables 2 and 3, respectively. For this research question, 24 articles were included. In Table 1, these 24 studies are indicated in bold. The first column of both Tables 2 and 3 shows how the specific type of sedentary activity (e.g. total sedentary time, TV time) was reported (e.g. percentage or minutes) over a specific time period (e.g. weekend day, after school). To keep the Tables as comparable as possible, we only included values of the total sample, except if an article only reported results for boys and girls separately. Some articles also reported the outcome variable separately for regions within a country. For the HBSC-report that was released in 2016 with data of 2013/2014 [50], the values of the 11-year-olds were included in the Table for children, and the values of the 15-year-olds were included in the Table for adolescents.
Table 2.
Levels of sedentary time in children (0-12 years) across European countries
| Total sedentary time | Armenia | Albania | Austria | Belgium | Bulgaria | Croatia | Cyprus | Czech Republic | |
| Min, h or %/day | 478 min(B)33, 511 min(G)33, 232 min64 | ||||||||
| Min or %/weekday | |||||||||
| Min or %/weekend day | |||||||||
| Min or %/school time | 65 %(G)32, 61 %(B)32 | ||||||||
| Min or %/leisure time | |||||||||
| Television time | |||||||||
| Min or h/day | 2.2 h61 | 116 min(G)29,FQ, 110 min(B)29,FQ, 78 min(G)29,recall, 77 min(B)29,recall, 2.7 h61 | 1.8 h28, 1.8 h64 | 1.2 h28 | |||||
| Min or h/weekday | 67 min63 | 79 min63 | |||||||
| Min or h/weekend day | 116 min63 | 131 min63 | |||||||
| % >1 h before school | |||||||||
| % >2 h/day | 36(B)62, 32(G)62 | 50(B)62, 42(G)62 | |||||||
| % >2 h/weekday | 48(B)51, 47(G)51 | 51(B)51, 47(G)51 | 50(B)51, 40(G)51 | 55(B,FL)51, 54(G,FL)51, 48(B,FR)51, 43(G,FR)51 | 64(B)51, 66(G)51 | 49(B)51, 47(G)51 | 62(B)51, 48(G)51 | ||
| % <1 h/day, 1-3 h/day, 3-5 h/day, >5 h/day | |||||||||
| Computer time | |||||||||
| Min or h/day | 89 min(B)29,FQ, 69 min(G)29,FQ, 47 min(B)29,recall, 29 min(G)29,recall | 0.7 h28 | 0.5 h28 | ||||||
| Min or h/weekday | 15 min63 | 28 min63 | |||||||
| Min or h/weekend day | 29 min63 | 44 min63 | |||||||
| % >1 h/day | 41(B)62, 16(G)62 | 35(B)62, 20(G)62 | |||||||
| % >2 h/weekday | 2751 | 2051 | 2651 | 32(FL)51, 28(FR)51 | 5051 | 2651 | 3551 | ||
| Videogames time | |||||||||
| % >2 h/weekday | 2351 | 2851 | 3151 | 33(FL)51, 33(FR)51 | 5651 | 2551 | 3751 | ||
| Total screen-time | |||||||||
| Min or h/day | 205 min(B)29,FQ, 178 min(G)29,FQ, 124 min(B)29,recall, 107 min(G)29,recall | 2.5 h28 | 1.7 h28 | ||||||
| % <1 h/weekday | 4363 | 2563 | |||||||
| % <1 h/weekend day | 1663 | 963 | |||||||
| % >2 h/day | |||||||||
| % not at all, <0.5 h, 0.5-1 h, 1-2 h, 2-3 h, >3 h/day | 2, 13, 32, 28, 15, 1155 | 2, 8, 20, 32, 17, 1255 | |||||||
| Total sedentary time | Denmark | Estonia | Finland | France | Germany | Greece | Hungary | ||
| Min, h or %/day | 268 min53, 356 min53 | 343 min53 | 8.8 h60 | 526 min(B)33, 510 min(G)33, | 487 min(B)33, 475 min(G)33 | ||||
| Min or %/weekday | 311 min(B)37, 309 min(G)37 | 277 min(B)37, 307 min(G)37 | |||||||
| Min or %/weekend day | 299 min(B)37, 280 min(G)37 | 239 min(B)37, 257 min(G)37 | |||||||
| Min or %/school time | 115 min(B)37, 128 min(G)37 | 122 min(B)37, 138 min(G)37 | 61 %(B)32, 66 %(G)32 | 65 %(B)32, 70 %(G)32 | |||||
| Min or %/leisure time | 152 min(B)37, 136 min(G)37 | 132 min(B)37, 146 min(G)37 | |||||||
| Television time | |||||||||
| Min or h/day | 2.2 h61 | 126 min(B)29,FQ, 120 min(G)29,FQ, 99 min(B)29,recall, 89 min(G)29,recall, 2.2 h64 | 123 min(B)29,FQ, 116 min(G)29,FQ, 90 min(B)29,recall, 85 min(G)29, recall | ||||||
| Min or h/weekday | 43 min63 | 89 min63 | |||||||
| Min or h/weekend day | 65 min63 | 134 min63 | |||||||
| % >1 h before school | 439 | 1439 | |||||||
| % >2 h/day | 38(B)62, 32(G)62 | 1526 | |||||||
| % >2 h/weekday | 1539, 60(B)51, 49(G)51 | 4239, 61(B)51, 56(G)51 | 58(B)51, 55(G)51 | 50(B)51, 39(G)51 | 45(B)51, 36(G)51 | 53(B)51, 45(G)51 | 47(B)51, 40(G)51 | ||
| % <1 h/day, 1-3 h/day, 3-5 h/day, >5 h/day | 9, 58, 24, 858 | 17, 63, 14, 558 | |||||||
| Computer time | |||||||||
| Min or h/day | 88 min(B)29,FQ, 60 min(G)29,FQ, 55 min(B)29,recall, 33 min(G)29,recall | 110 min(B)29,FQ, 82 min(G)29,FQ, 75 min(B)29,recall, 46 min(G)29,recall | |||||||
| Min or h/weekday | 9 min63 | 18 min63 | |||||||
| Min or h/weekend day | 15 min63 | 30 min63 | |||||||
| % >1 h/day | 1539, 39(B)62, 13(G)62 | 1639 | |||||||
| % >2 h/weekday | 4051 | 3751 | 3351 | 2951 | 2751 | 2551 | 2751 | ||
| Videogames time | |||||||||
| % >2 h/weekday | 5351 | 4351 | 3051 | 3351 | 2551 | 2851 | 3451 | ||
| Total screen-time | |||||||||
| Min or h/day | 2.760 | 0.7 h64 | 214 min(B)29,FQ, 179 min(G)29,FQ, 155 min(B)29,recall, 122 min(G)29,recall | 233 min(B)29,FQ, 198 min(G)29,FQ, 166 min(B)29,recall, 131 min(G)29,recall | |||||
| % <1 h/weekday | 7163 | 2963 | |||||||
| % <1 h/weekend day | 5263 | 1263 | |||||||
| % >2 h/day | 3452, 4752 | 6252 | 5760 | ||||||
| % not at all, <0.5 h, 0.5-1 h, 1-2 h, 2-3 h, >3 h/day | 1, 6, 19, 24, 18, 3255 | 4, 12, 26, 26, 14, 1355 | 4, 15, 27, 25, 15, 1255 | ||||||
| Total sedentary time | Iceland | Ireland | Italy | Latvia | Lithuania | Luxembourg | Malta | Moldova | Netherlands |
| Min, h or %/day | 447 min(B)33, 457 min(G)33 | ||||||||
| Min or %/weekday | |||||||||
| Min or %/weekend day | |||||||||
| Min or %/school time | 65 %(B)32, 68 %(G)32 | ||||||||
| Min or %/leisure time | |||||||||
| Television time | |||||||||
| Min or h/day | 2.0 h61 | 1.8 h28 | 116 min(B)29, FQ, 104 min(G)29, FQ, 83 min(B)29, recall, 67 min(G)29, recall, 2.7 h61 | ||||||
| Min or h/weekday | |||||||||
| Min or h/weekend day | |||||||||
| % >1 h before school | |||||||||
| % >2 h/day | 35(B)62, 23(G)62 | 50(B)38, 46(G)38 | |||||||
| % >2 h/weekday | 40(B)51, 30(G)51 | 46(B)51, 42(G)51 | 47(B)51, 40(G)51 | 63(B)51, 56(G)51 | 59(B)51, 54(G)51 | 44(B)51, 37(G)51 | 53(B)41, 41(G)51 | 54(B)51, 53(G)51 | 61(B)51, 61(G)51 |
| % <1 h/day, 1-3 h/day, 3-5 h/day, >5 h/day | 19, 64, 15, 258 | ||||||||
| Computer time | |||||||||
| Min or h/day | 0.9 h28 | 106 min (B)29,FQ, 81 min (G)29,FQ, 71 min(B)29,recall, 45 min(G)29,recall | |||||||
| Min or h/weekday | |||||||||
| Min or h/weekend day | |||||||||
| % >1 h/day | 36(B)62, 12(G)62 | 53(B)62, 26(G)62 | |||||||
| % >2 h/weekday | 3151 | 2951 | 2751 | 3851 | 2651 | 2751 | 3551 | 3151 | 4251 |
| Videogames time | |||||||||
| % >2 h/weekday | 3951 | 3151 | 3251 | 3951 | 4051 | 2951 | 4251 | 3651 | 4951 |
| Total screen-time | |||||||||
| Min or h/day | 2.6 h28 | 223 min(B)29,FQ, 185 min(G)29,FQ, 153 min(B)29,recall, 112 min(G)29,recall | |||||||
| % <1 h/weekday | |||||||||
| % <1 h/weekend day | |||||||||
| % >2 h/day | |||||||||
| % not at all, <0.5 h, 0.5-1 h, 1-2 h, 2-3 h, >3 h/day | 2, 8, 20, 27, 19, 2455 | ||||||||
| Total sedentary time | Norway | Poland | Portugal | Romania | Russian Federation | Slovakia | Slovenia | ||
| Min, h or %/day | 325 min53 | 367 min53, 9.2 h60 | |||||||
| Min or %/weekday | 298 min(B)37, 314 min(G)37 | 318 min(B)37, 344 min(G)37 | |||||||
| Min or %/weekend day | 289 min(B)37, 280 min(G)37 | 269 min(B)37, 279 min(G)37 | |||||||
| Min or %/school time | 128 min(B)37, 140 min(G)37 | 146 min(B)37, 153 min(G)37 | |||||||
| Min or %/leisure time | 137 min(B)37, 138 min(G)37 | 153 min(B)37, 169 min(G)37 | |||||||
| Television time | |||||||||
| Min or h/day | 105 min(B)29,FQ, 97 min(G)29,FQ, 72 min(B)29,recall, 62 min(G)29,recall, 2.2 h61 | 1.3 h28, 2.7 h61 | 120 min(B)29,FQ, 108 min(G)29,FQ, 78 min(B)29,recall, 68 min(G)29,recall | ||||||
| Min or h/weekday | 71 min63 | ||||||||
| Min or h/weekend day | 116 min73 | ||||||||
| % >1 h before school | 939 | 1539 | |||||||
| % >2 h/day | 38(B)62, 35(G)62 | 49(B)62, 42(G)62 | |||||||
| % >2 h/weekday | 2539, 46(B)51, 41(G)51 | 56(B)51, 49(G)51 | 3139, 52(B)51, 45(G)51 | 67(B)51, 56(G)51 | 57(B)51, 52(G)51 | 59(B)51, 54(G)51 | 49(B)51, 40(G)51 | ||
| % <1 h/day, 1-3 h/day, 3-5 h/day, >5 h/day | 18, 69, 11, 3(Krakow)58; 11, 73 12, 3(Poznan)58 | 13, 58, 23, 658 | |||||||
| Computer time | |||||||||
| Min or h/day | 91 min(B)29,FQ, 71 min(G)29,FQ, 60 min(B)29,recall, 40 min(G)29,recall | 0.5 h28 | 93 min(B)29,FQ, 64 min(G)29,FQ, 52 min(B)29,recall, 33 min(G)29,recall | ||||||
| Min or h/weekday | 16 min63 | ||||||||
| Min or h/weekend day | 32 min63 | ||||||||
| % >1 h/day | 2739, 24(B)62, 10(G)62 | 2739, 40(B)62, 17(G)62 | |||||||
| % >2 h/weekday | 3451 | 3551 | 2451 | 3551 | 4251 | 4051 | 2551 | ||
| Videogames time | |||||||||
| % >2 h/weekday | 3151 | 3351 | 2551 | 4451 | 4251 | 4351 | 2451 | ||
| Total screen-time | |||||||||
| Min or h/day | 196 min(B)29,FQ, 168 min (G)29,FQ, 132 min (B)29,recall, 101 min (G)29,recall | 1.8 h28, 2.3 h60 | 213 min(B)29, FQ, 174 min(G)29, FQ, 131 min(B)29, recall, 100 min(G)29, recall | ||||||
| % <1 h/weekday | 3763 | ||||||||
| % <1 h/weekend day | 1663 | ||||||||
| % >2 h/day | 4952 | 6452, 4960 | |||||||
| % not at all, <0.5 h, 0.5-1 h, 1-2 h, 2-3 h, >3 h/day | |||||||||
| Total sedentary time | Spain | Sweden | Switzerland | Macedonia | Turkey | Ukraine | UK | ||
| Min, h or %/day | 467 min(B)33, 498 min(G)33, 236 min53, 278 min53 | 356 min53, 362 min53, 352 min53, 192 min(SC)53, 8.3 h60 | |||||||
| Min or %/weekday | |||||||||
| Min or %/weekend day | |||||||||
| Min or %/school time | |||||||||
| Min or %/leisure time | |||||||||
| Television time | |||||||||
| Min or h/day | 109 min(B)29,FQ, 97 min(G)29,FQ, 77 min(B)29,recall, 64 min(G)29,recall, 2.2 h61 | 1.3 h28, 2.1 h61 | |||||||
| Min or h/weekday | 66 min63 | ||||||||
| Min or h/weekend day | 122 min63 | ||||||||
| % >1 h before school | |||||||||
| % >2 h/day | 37(B)62, 31(G)62, 864 | 32(B)62, 31(G)62 | 2826 | ||||||
| % >2 h/weekday | 43(B)51, 30(G)51 | 58(B)51, 51(G)51 | 32(B)51, 29(G)51 | 46(B)51, 43(G)51 | 52(B)51, 46(G)51 | 51(B,ENG)51, 51(G,ENG)51, 60(B,SC)51, 51(G,SC)51, 62(B,WAL)51, 53(G,WAL)51 | |||
| % <1 h/day, 1-3 h/day, 3-5 h/day, >5 h/day | 24, 62, 12, 2(A Coruña)58; 27, 59, 11, 3(Asturias)58; 19, 59, 19, 3(Barcelona)58; 34, 54, 10, 2(Bilbao)58; 15, 63, 19, 4(Cartagena)58; 18, 61, 18, 3(Madrid)58; 22, 61, 14, 2(Valencia)58 |
||||||||
| Computer time | |||||||||
| Min or h/day | 85 min(B)29,FQ, 63 min(G)29,FQ, 45 min(B)29,recall, 25 min(G)29,recall | 0.6 h28 | |||||||
| Min or h/weekday | 13 min63 | ||||||||
| Min or h/weekend day | 31 min63 | ||||||||
| % >1 h/day | 22(B)62, 15(G)62 | 35(B)62, 18(G)62 | |||||||
| % >2 h/weekday | 2251 | 4051 | 1851 | 3651 | 3351 | ||||
| Videogames time | |||||||||
| % >2 h/weekday | 2351 | 4451 | 2051 | 3451 | 3351 | 41(ENG)51, 51(SC)51, 49(WAL)51 | |||
| Total screen-time | 41(ENG)51, 44(SC)51, 50(WAL)51 | ||||||||
| Min or h/day | 193 min(B)29,FQ, 160 min(G)29,FQ, 122 min(B)29,recall, 89 min(G)29,recall | 1.9 h28 | 2.9 h60 | ||||||
| % <1 h/weekday | 4463 | ||||||||
| % <1 h/weekend day | 1263 | ||||||||
| % >2 h/day | 47(ENG)52, 59(ENG)52, 6860 | ||||||||
| % not at all, <0.5 h, 0.5-1 h, 1-2 h, 2-3 h, >3 h/day | 6, 22, 28, 26, 12, 655 | ||||||||
This table displays a summary of the results reported in the articles included in the systematic review; B boys, G girls, min minutes, h hours, FQ usual frequency question, FL Flemish part of Belgium, FR French part of Belgium, ENG England, SC Scotland, WAL Wales; references are displayed in superscript to avoid confusion with the levels of sedentary time
Table 3.
Levels of sedentary time in adolescents (13-18 years) across European countries
| Total sedentary time | Albania | Armenia | Austria | Belgium | Bulgaria | Croatia | Czech Republic |
| Min or %/day | |||||||
| Min or %/weekday | |||||||
| Min or %/weekend day | |||||||
| Min or %/school time | |||||||
| Min or %/leisure time | |||||||
| Television time | |||||||
| Min or h/day | |||||||
| Min or h/weekday | 2.6-2.5-2.3 h(B,FL)50, 2.3-2.4-2.2 h(G,FL)50, 2.2-2.2-2.0 h(B,FR)50, 2.1-1.9-1.8 h(G,FR)50 |
3.0-3.0-2.7 h(B)50, 2.7-2.8-2.6 h(G)50 |
2.8-2.5-2.3 h(B)50, 2.5-2.3-2.2 h(G)50 |
||||
| Min or h/weekend day | 3.7-3.4-3.2 h(B,FL)50, 3.1-3.2-3.1 h(G,FL)50, 3.5-3.4-3.2(B,FR)50, 3.2-3.1-3.1 h(G,FR)50 |
3.9-3.5-3.3 h(B)50, 3.7-3.4-3.2 h(G)50 | 3.2-3.2-3.0 h(B)50, 2.9-2.9-2.7 h(G)50 | ||||
| % >2 h/day | 38(B)45, 33(G)45 | 40(B,FL)45, 40(G,FL)45, 33(B,FR)45, 26(G,FR)45 | 60(B)45, 66(G)45 | 44(B)45, 50(G)45 | 42(B)45, 38(G)45 | ||
| % >2 h/weekday | 73(B)51, 75(G)51 | 73(B)51, 66(G)51 | 54(B)51, 57(G)51 | 61(B,FL)51, 59(G,FL)51, 64(B,FR)51, 55(G,FR)51 | 70(B)51, 72(G)51 | 66(B)51, 59(G)51 | 65(B)51, 59(G)51 |
| % >3 h/weekday | 3140 | 40(FL)40, 34(FR)40 | 5340 | 4740 | |||
| % <1 h/day, 1-3 h/day, 3-5 h/day, >5 h/day | 9, 39, 31, 2058 | ||||||
| % ≤0.5 h, 1-2 h, 3-4 h, >4 h/schoolday | |||||||
| Computer time | |||||||
| Min or h/day | |||||||
| Min or h/weekday | 1.4-3.3-3.2 h(B,FL)50, 0.9-2.5-2.5 h(G,FL)50, 1.4-2.9-2.8 h(B;FR)50, 0.7-2.4-2.4 h(G,FR)50 |
1.2-2.7-3.8 h(B)50, 0.5-1.6-2.9 h(G)50 |
1.6-3.2-4.0 h(B)50, 0.7-1.9-3.0 h(G)50 |
||||
| Min or h/weekend day | 2.3-4.7-4.7 h(B,FL)50, 1.4-3.4-3.5 h(G,FL)50, 2.5-5.1-4.9 h(B,FR)50, 1.2-4.0-4.2 h(G,FR)50 |
1.9-3.7-5.0 h(B)50, 0.9-2.2-3.9 h(G)50 |
1.9-4.0-4.8 h(B)50, 0.8-2.4-3.6 h(G)50 |
||||
| % >1 h/day | |||||||
| % >2 h/day | 20(B)45, 15(G)45 | 23(B,FL)45, 23(G,FL)45, 17(B,FR)45, 15(G,FR)45 | 30(B)45, 24(G)45 | 12(B)45, 10(G)45 | 14(B)45, 14(G)45 | ||
| % >2 h/weekday | 5051 | 4851 | 2540, 5351 | 26(FL)40, 22(FR)40, 60(FL)51, 60(FR)51 | 6951 | 2040, 5751 | 2640, 6551 |
| Videogames time | |||||||
| Min or h/day | |||||||
| % >2 h/day | 28(B)45, 12(G)45 | 22(B,FL)45, 8(G,FL)45, 23(B,FR)45, 15(G,FR)45 | 44(B)45, 18(G)45 | 25(B)45, 5(G)45 | 31(B)45, 7(G)45 | ||
| % >2 h/weekday | 4051 | 3551 | 3651 | 32(FL)51, 49(FR)51 | 5351 | 3251 | 4251 |
| Total screen-time | |||||||
| Min or h/day | |||||||
| Min or h/weekday | |||||||
| Total sedentary time | Denmark | Estonia | Finland | France | Germany | Greece | |
| Min or %/day | 268 min53, 356 min53 | 506 min(B)38, 496 min(G)38, 343 min53 | |||||
| Min or %/weekday | 454 min(B)37, 457 min(G)37 | 388 min(B)37, 344 min(G)37, 526 min(B)38, 521 min(G)38 | |||||
| Min or %/weekend day | 412 min(B)37, 412 min(G)37 | 331 min(B)37, 367 min(G)37, 459 min(B)38, 434 min(G)38 | |||||
| Min or %/school time | 205 min(B)37, 218 min(G)37 | 186 min(B)37, 227 min(B)37 | |||||
| Min or %/leisure time | 205 min(B)37, 191 min(G)37 | 168 min(B)37, 187 min(B)37 | |||||
| Television time | |||||||
| Min or h/day | |||||||
| Min or h/weekday | 2.6-2.4-2.4 h(B)50, 2.5-2.3-2.2 h(G)50 |
3.4-2.8-2.4(B)50, 3.0-2.7-2.4 h(G)50 |
2.3-2.0-2.0 h(B)50, 2.3-1.9-1.8 h(G)50 |
2.3-2.3-2.1 h(B)50, 2.1-2.1-2.0 h(G)50 |
2.4-2.3-2.1 h(B)50, 2.2-2.1-2.0 h(G)50 |
2.5-2.7-2.7 h(B)50, 2.1-2.8-2.5 h(G)50 |
|
| Min or h/weekend day | 3.3-3.2-3.2 h(B)50, 3.1-3.0-3.0 h(G)50 |
4.0-3.5-3.3(B)50, 3.9-3.5-3.2 h(G)50 |
3.3-2.8-2.8 h(B)50, 3.1-2.7-2.7 h(G)50 |
3.2-3.2-3.0 h(B)50, 3.0-2.9-2.9 h(G)50 |
3.4-3.5-3.3 h(B)50, 3.0-3.1-3.0 h(G)50 |
3.5-3.6-3.6 h(B)50, 3.3-3.6-3.5 h(G)50 |
|
| % >1 h before school | 40(B)45, 36(G)45 | 51(B)45, 50(G)45 | 28(B)45, 27(G)45 | 37(B)45, 32(G)45 | 36(B)45, 33(G)45 | 48(B)45, 53(G)45 | |
| % >2 h/day | |||||||
| % >2 h/weekday | 71(B)51, 68(G)51 | 59(B)51, 57(G)51 | 61(B)51, 52(G)51 | 62(B)51, 58(G)51 | 66(B)51, 60(G)51 | 71(B)51, 65(G)51 | |
| % >3 h/weekday | 4540 | 6340 | 4040 | 3440, 6451 | 3940 | 3840 | |
| % <1 h/day, 1-3 h/day, 3-5 h/day, >5 h/day | 4, 28, 40, 2858 | 5, 39, 37, 1958 | |||||
| % ≤0.5 h, 1-2 h, 3-4 h, >4 h/schoolday | 25, 52, 17, 627 | ||||||
| Computer time | |||||||
| Min or h/day | |||||||
| Min or h/weekday | 1.9-3.6-4.3 h(B)50, | 1.8-4.4-4.5 h(B)50, | 1.4-3.2-3.4 h(B)50, | 1.0-2.7-3.3 h(B)50, | 1.5-3.2-3.2 h(B)50, | 1.2-2.6-3.7 h(B)50, | |
| 0.7-2.1-2.9 h(G)50 | 0.9-3.0-3.5 h(G)50 | 0.6-2.0-2.5 h(G)50 | 0.6-1.9-2.6 h(G)50 | 0.7-2.2-2.6 h(G)50 | 0.5-1.1-2.3 h(G)50 | ||
| Min or h/weekend day | 2.3-4.4-5.4 h(B)50, | 2.3-5.5-5.7 h(B)50, | 2.0-4.2-4.7 h(B)50, | 1.5-4.1-4.9 h(B)50, | 2.0-4.7-4.8 h(B)50, | 1.9-4.2-5.5 h(B)50, | |
| 0.8-2.5-3.4 h(G)50 | 1.1-3.8-4.4 h(G)50 | 0.8-2.7-3.5 h(G)50 | 0.9-2.9-3.9 h(G)50 | 1.0-3.0-3.7 h(G)50 | 0.8-1.8-3.7(G)50 | ||
| % >1 h/day | |||||||
| % >2 h/day | 20(B)45, 17(G)45 | 32(B)45, 30(G)45 | 17(B)45, 17(G)45 | 16(B)45, 16(G)45 | 19(B)45, 17(G)45 | 10(B)45, 4(G)45 | |
| % >2 h/weekday | 2940, 6751 | 3240, 7251 | 2340, 5951 | 1640 | 2540, 6651 | 2140, 5951 | |
| Videogames time | |||||||
| Min or h/day | |||||||
| % >2 h/day | 32(B)45, 8(G)45 | 41(B)45, 14(G)45 | 24(B)45, 6(G)45 | 20(B)45, 6(G)45 | 25(B)45, 10(G)45 | 26(B)45, 6(G)45 | |
| % >2 h/weekday | 4251 | 4151 | 2951 | 3851 | 5051 | 3851 | |
| Total screen-time | |||||||
| Min or h/day | |||||||
| Min or h/weekday | |||||||
| Total sedentary time | Hungary | Iceland | Ireland | Italy | Latvia | Lithuania | |
| Min or %/day | |||||||
| Min or %/weekday | |||||||
| Min or %/weekend day | |||||||
| Min or %/school time | |||||||
| Min or %/leisure time | |||||||
| Television time | |||||||
| Min or h/day | 100 min25 | ||||||
| Min or h/weekday | 2.4-2.3-2.2 h(B)50, 2.2-2.1-2.1 h(G)50 |
2.3-2.3-2.1 h(B)50, 2.5-2.2-2.0 h(G)50 |
3.4-3.0-2.5 h(B)50, 2.9-2.8-2.5 h(G)50 |
||||
| Min or h/weekend day | 4.0-3.7-3.6 h(B)50, 3.9-3.6-3.5 h(G)50 |
2.6-2.6-2.6 h(B)50, 2.6-2.4-2.4 h(G)50 |
4.4-3.6-3.2 h(B)50, 4.1-3.5-3.2 h(G)50 |
||||
| % >2 h/day | 40(B)45, 36(G)45 | 36(B)45, 29(G)45 | 36(B)45, 37(G)45 | ||||
| % >2 h/weekday | 62(B)51, 58(G)51 | 58(B)51, 54(G)51 | 56(B)51, 54(G)51 | 59(B)51, 52(G)51 | 68(B)51, 67(G)51 | 58(B)51, 58(G)51 | |
| % >3 h/weekday | 3940 | 3840 | 4340 | 6340 | 5740 | ||
| % <1 h/day, 1-3 h/day, 3-5 h/day, >5 h/day | 7, 48, 32, 1458 | 12, 51, 26, 1158 | |||||
| % ≤0.5 h, 1-2 h, 3-4 h, >4 h/schoolday | 29, 55, 13, 327 | 20, 48, 23, 927 | |||||
| Computer time | |||||||
| Min or h/day | 8 min25 | ||||||
| Min or h/weekday | 1.4-3.0-3.7 h(B)50, 0.7-1.8-2.6 h(G)50 |
1.1-2.3-3.1 h(B)50, 0.7-1.4-2.7 h(G)50 |
1.4-3.6-3.9 h(B)50, 0.7-2.4-2.8 h(G)50 |
||||
| Min or h/weekend day | 2.4-5.2-6.2 h(B)50, 1.2-3.2-4.5 h(G)50 |
1.3-2.7-3.8 h(B)50, 0.8-1.6-3.3 h(G)50 |
2.0-4.3-4.8 h(B)50, 1.0-2.9-3.5 h(G)50 |
||||
| % >1 h/day | |||||||
| % >2 h/day | 18(B)45, 12(G)45 | 26(B)45, 23(G)45 | 9(B)45, 8(G)45 | ||||
| % >2 h/weekday | 2340, 5851 | 6151 | 6151 | 2040, 5551 | 2740, 6551 | 2340, 4651 | |
| Videogames time | |||||||
| Min or h/day | 26 min25 | ||||||
| % >2 h/day | 24(B)45, 8(G)45 | 27(B)45, 3(G)45 | 17(B)45, 4(G)45 | ||||
| % >2 h/weekday | 4451 | 4051 | 3051 | 4151 | 3951 | 4851 | |
| Total screen-time | |||||||
| Min or h/day | 156 min(B)23, 114 min(G)23 | ||||||
| Min or h/weekday | 282 min(B)23, 192 min(G)23 | ||||||
| Total sedentary time | Luxembourg | Moldova | Malta | Netherlands | Norway | Poland | Portugal |
| Min or %/day | 325 min55 | 367 min55 | |||||
| Min or %/weekday | 445 min(B)37, 466 min(G)37 | 411 min(B)37, 435 min(G)37 | |||||
| Min or %/weekend day | 385 min(B)37, 402 min(G)37 | 344 min(B)37, 351 min(G)37 | |||||
| Min or %/school time | 206 min(B)37, 228 min(G)37 | 206 min(B)37, 217 min(G)37 | |||||
| Min or %/leisure time | 189 min(B)37, 190 min(G)37 | 183 min(B)37, 191 min(G)37 | |||||
| Television time | |||||||
| Min or h/day | |||||||
| Min or h/weekday | 2.8-3.0-2.8 h(B)50, 2.4-2.7-2.6 h(G)50 |
2.7-2.1-2.0 h(B)50, 2.6-2.2-2.0 h(G)50 |
3.0-2.6-2.5 h(B)50, 2.6-2.4-2.3 h(G)50 |
2.8-3.0-2.5 h(B)50, 2.9-3.0-2.5 h(G)50 |
|||
| Min or h/weekend day | 3.6-3.4-3.2 h(B)50, 3.3-3.3-3.1 h(G)50 |
3.6-3.0-2.9 h(B)50, 3.3-2.9-2.9 h(G)50 |
4.0-3.8-3.4 h(B)50, 3.7-3.7-3.4 h(G)50 |
3.9-4.0-3.8 h(B)50, 3.8-4.0-3.9 h(G)50 |
|||
| % >2 h/day | 32(B)45, 28(G)45 | 50(B)45, 44(G)45 | 55(B)45, 41(G)45 | 54(B)45, 56(G)45 | |||
| % >2 h/weekday | 66(B)51, 61(G)51 | 73(B)51, 77(G)51 | 65(B)51, 54(G)51 | 73(B)51, 75(G)51 | 63(B)51, 61(G)51 | 62(B)51, 64(G)51 | 55(B)51, 51(G)51 |
| % >3 h/weekday | 4340 | 4540 | 4840 | 5340 | 5240 | ||
| % <1 h/day, 1-3 h/day, 3-5 h/day, >5 h/day | 9, 46, 29, 17(Krakow)58; 8, 54, 27, 12(Poznan)58 |
11, 37, 30, 22(Funchal)58; 5,36, 36, 23(Lisbon)58; 7, 36, 34, 23(Portimao)58; 8, 45, 30, 18(Porto)58 |
|||||
| % ≤0.5 h, 1-2 h, 3-4 h, >4 h/schoolday | 24, 57, 17, 227 | 19, 49, 24, 827 | |||||
| Computer time | |||||||
| Min or h/day | |||||||
| Min or h/weekday | 1.7-4.6-4.5 h(B)50, | 1.9-3.1-3.3 h(B)50, | 1.6-4.2-4.8 h(B)50, | 1.5-3.8-3.8 h(B)50, | |||
| 1.0-3.2-3.4 h(G)50 | 0.8-2.2-2.5 h(G)50 | 0.8-2.2-3.2 h(G)50 | 0.7-2.6-2.8 h(G)50 | ||||
| Min or h/weekend day | 2.4-5.1-4.9 h(B)50, 1.4-3.7-3.6 h(G)50 |
2.3-4.1-4.1 h(B)50, 1.0-2.8-2.8 h(G)50 |
2.5-6.0-6.5 h(B)50, 1.3-3.4-4.7 h(G)50 |
2.2-5.2-5.9 h(B)50, 1.0-3.4-4.3 h(G)50 |
|||
| % >1 h/day | 26.812 | 29.730 | |||||
| % >2 h/day | 18(B)45, 17(G)45 | 31(B)45, 31(G)45 | 36(B)45, 35(G)45 | 30(B)45, 21(G)45 | 23(B)45, 22(G)45 | ||
| % >2 h/weekday | 6751 | 6651 | 2040, 6951 | 3140, 7851 | 3140, 7451 | 3240, 7051 | 2540, 4951 |
| Videogames time | |||||||
| Min or h/day | |||||||
| % >2 h/day | 21(B)45, 9(G)45 | 37(B)45, 10(G)45 | 36(B)45, 8(G)45 | 36(B)45, 14(G)45 | |||
| % >2 h/weekday | 4451 | 4151 | 5751 | 5651 | 4851 | 3251 | 3251 |
| Total screen-time | |||||||
| Min or h/day | |||||||
| Min or h/weekday | |||||||
| Total sedentary time | Romania | Russian Federation | Slovakia | Slovenia | Spain | Sweden | |
| Min or %/day | 486 min(B)38, 482 min(G)38 | ||||||
| Min or %/weekday | 498 min(B)38, 503 min(G)38 | ||||||
| Min or %/weekend day | 455 min(B)38, 430 min(G)38 | ||||||
| Min or %/school time | |||||||
| Min or %/leisure time | |||||||
| Television time | |||||||
| Min or h/day | 87 min25 | 142 min25 | |||||
| Min or h/weekday | 3.2-2.8-2.5 h(B)50, 2.8-2.8-2.6 h(G)50 |
2.5-2.4-2.1 h(B)50, 2.2-2.1-1.9 h(G)50 |
2.5-2.2-2.2 h(B)50, 2.4-2.1-2.0 h(G)50 |
2.3-2.1-2.2 h(B)50, 2.2-2.0-2.1 h(G)50 |
|||
| Min or h/weekend day | 3.9-3.7-3.2 h(B)50, 3.7-3.7-3.4 h(G)50 |
3.3-3.2-2.9 h(B)50, 2.9-3.0-2.8 h(G)50 |
3.3-3.0-2.7 h(B)50, 3.2-2.8-2.5 h(G)50 |
3.2-2.8-3.0 h(B)50, 2.9-2.6-2.8 h(G)50 |
|||
| % >2 h/day | 40(B)45, 52(G)45 | 49(B)45, 50(G)45 | 57(B)45, 56(G)45 | 39(B)45, 33(G)45 | 36(B)45, 33(G)45 | ||
| % >2 h/weekday | 73(B)51, 75(G)51 | 63(B)51, 60(G)51 | 70(B)51, 69(G)51 | 59(B)51, 50(G)51 | 63(B)51, 59(G)51 | 70(B)51, 67(G)51 | |
| % >3 h/weekday | 5640 | 4040 | 4340 | 3740 | |||
| % <1 h/day, 1-3 h/day, 3-5 h/day, >5 h/day | 12, 52, 26, 11(A Coruña)58; 13, 50, 27, 11(Asturias)58; 10, 44, 31, 16(Barcelona)58; 12, 47, 27, 14(Bilbao)58; 8, 41, 34, 17(Cartagena)58; 9, 45, 32, 14(Madrid)58; 14, 50, 25, 11(San Sebastian)58, 9, 47, 30, 15(Valencia)58; 8, 46, 31, 15(Valladolid)58 | ||||||
| % ≤0.5 h, 1-2 h, 3-4 h, >4 h/schoolday | |||||||
| Computer time | |||||||
| Min or h/day | 15 min25 | 3 min25 | |||||
| Min or h/weekday | 1.7-2.8-4.3 h(B)50, 0.7-1.8-3.6 h(G)50 |
1.3-3.1-3.4 h(B)50, 0.6-1.9-2.5 h(B)50 |
1.1-2.2-3.2 h(B)50, 0.7-1.6-2.8 h(G)50 |
1.8-3.6-4.1 h(B)50, 0.9-2.3-3.1 h(G)50 |
|||
| Min or h/weekend day | 2.4-3.8-5.6 h(B)50, 1.0-2.6-4.7 h(G)50 |
2.1-4.2-4.6 h(B)50, 1.1-2.7-3.3 h(G)50 |
1.8-3.7-4.1 h(B)50, 1.1-2.5-3.7 h(G)50 |
2.3-4.3-5.1 h(B)50, 1.1-2.7-3.7 h(G)50 |
|||
| % >1 h/day | |||||||
| % >2 h/day | 24(B)45, 16(G)45 | 12(B)45, 9(G)45 | 17(B)45, 13(G)45 | 17(B)45, 16(G)45 | 11(B)45, 10(G)45 | ||
| % >2 h/weekday | 5951 | 3040, 7051 | 2340, 6851 | 5851 | 2040, 6751 | 3240, 7451 | |
| Videogames time | |||||||
| Min or h/day | 16 min25 | 23 min25 | |||||
| % >2 h/day | 45(B)45, 24(F)45 | 30(M)45, 13(F)45 | 35(B)45, 11(G)45 | 26(B)45, 6(G)45 | 16(B)45, 7(G)45 | ||
| % >2 h/weekday | 4651 | 4251 | 4751 | 2751 | 3951 | 4651 | |
| Total screen-time | |||||||
| Min or h/day | 125 min(B)23, 111 min(G)23 | 118 min(B)23, 139 min(G)23 | |||||
| Min or h/weekday | 152 min(B)23, 120 min(G)23 | 252 min(B)23, 196 min(G)23 | |||||
| Total sedentary time | Switzerland | Macedonia | Turkey | Ukraine | UK | ||
| Min or %/day | 356 min53, 362 min53, 352 min53 | ||||||
| Min or %/weekday | |||||||
| Min or %/weekend day | |||||||
| Min or %/school time | |||||||
| Min or %/leisure time | |||||||
| Television time | |||||||
| Min or h/day | 119 min25 | ||||||
| Min or h/weekday | 1.8-1.6-1.4 h(B)50, 1.7-1.4-1.3 h(G)50 |
2.8-2.5-2.4 h(B)50, 2.5-2.5-2.4 h(G)50 |
3.6-2.9-2.5 h(B)50, 3.3-3.0-2.6 h(G)50 |
2.9-2.7-2.5 h(B,SC)50, 2.8-2.5-2.3 h(G,SC)50, 2.9-2.6-2.6 h(B,WAL)50, 2.9-2.5-2.3 h(G,WAL)50 |
|||
| Min or h/weekend day | 2.9-2.6-2.5 h(B)50, 2.6-2.4-2.4 h(G)50 |
3.5-3.5-3.1 h(B)50, 3.3-3.6-3.2 h(G)50 |
4.5-3.7-3.2 h(B)50, 4.5-4.0-3.3 h(G)50 |
3.4-3.2-3.2 h(B,SC)50, 3.2-2.8-2.9 h(G,SC)50
3.4-3.2-3.2 h(B,WAL)50, 3.5-3.0-2.9 h(G,WAL)50 |
|||
| % >2 h/day | 19(B)45, 17(G)45 | 44(B)45, 45(G)45 | 43(B)45, 41(G)45 | 54(B)45, 57(G)45 | 37(B, ENG)45, 31(G,ENG)45 | ||
| % >2 h/weekday | 58(B)51, 51(G)51 | 57(B)51, 56(G)51 | 61(B)51, 64(G)51 | 67(B,ENG)51, 66(G,ENG)51, 72(B,SC)51, 64(G,SC)51, 72(B,WAL)51, 73(G,WAL)51 | |||
| % >3 h/weekday | 2440 | 4840 | 6640 | 52(ENG)40, 50(SC)40, 53(WAL)40 | |||
| % <1 h/day, 1-3 h/day, 3-5 h/day, >5 h/day | 3, 34, 41, 2358 | ||||||
| % ≤0.5 h, 1-2 h, 3-4 h, >4 h/schoolday | 22, 50, 20, 8(SC)27 | ||||||
| Computer time | |||||||
| Min or h/day | 11 min25 | ||||||
| Min or h/weekday | 1.1-2.2-2.3 h(B)50, 0.6-1.4-1.8 h(G)50 |
1.4-3.0-3.4 h(B)50, 0.8-2.1-3.4 h(G)50 |
1.1-2.6-2.8 h(B)50, 0.4-1.2-2.1(G)50 |
2.1-3.9-4.5 h(B,SC)50, 1.2-2.8-3.5 h(G,SC)50, 1.7-3.6-4.2 h(B,WAL)50, 1.0-2.8-3.5 h(G,WAL)50 |
|||
| Min or h/weekend day | 1.9-3.8-4.0 h(B)50, 1.0-2.4-3.1 h(G)50 |
2.0-4.9-6.0 h(B)50, 1.2-3.6-5.2 h(G)50 |
1.6-3.7-3.7 h(B)50, 0.5-1.8-2.9 h(G)50 |
2.5-4.6-5.6(B,SC)50, 1.3-3.2-4.2 h(G,SC)50, 2.2-4.4-5.1 h(B,WAL)50, 1.3-3.3-4.2 h(G,WAL)50 |
|||
| % >1 h/day | |||||||
| % >2 h/day | 12(B)45, 8(G)45 | 16(B)45, 13(G)45 | 18(B)45, 16(G)45 | 12(B)45, 5(G)45 | 25(B,ENG)45, 25(G,ENG)45 | ||
| % >2 h/weekday | 1640, 5351 | 2640, 5551 | 1740, 6451 | 37(ENG)40, 39(SC)40, 33(WAL)40, 72(ENG)51, 78(SC)51, 72(WAL)51 |
|||
| Videogames time | |||||||
| Min or h/day | 37 min25 | ||||||
| % >2 h/day | 11(B)45, 3(G)45 | 26(B)45, 12(G)45 | 22(B)45, 8(G)45 | 25(B)45, 8(G)45 | 25(B,ENG)45, 8(G,ENG)45 | ||
| % >2 h/weekday | 3151 | 3651 | 4351 | 45(ENG)51, 54(SC)51, 50(WAL)51 | |||
| Total screen-time | |||||||
| Min or h/day | |||||||
| Min or h/weekday | |||||||
This table displays a summary of the results reported in the articles included in the systematic review; B boys, G girls, min minutes, h hours, FL Flemish part of Belgium, FR French part of Belgium, ENG England, SC Scotland, WAL Wales; references are displayed in superscript to avoid confusion with the levels of sedentary time
The data clearly show a large variation in reported outcome variables and assessment methods by article, which makes it difficult to describe the child and adolescent population levels. Despite this large variation, in general, higher values for sedentary time were observed in children and adolescents from more East-European countries as compared to the rest of Europe, especially for television viewing.
Further, large differences were observed between articles from the same country. One study illustrated the large differences that can be observed between assessment methods even within the same study, namely there were differences in television viewing, computer use and total screen-time recorded between the usual frequency and the 24 h-recall question type [28].
To provide a more accessible overview of the results, the bar charts in Fig. 2 display the amount of minutes per day that children spent in watching television across four countries using different assessment methods. Three articles were available [28, 60, 62]: one article had data for the four countries [28] and two articles had data for three out of four countries [60, 62]. In one article [28], television time was assessed by both a usual frequency and 24 h-recall questionnaire. In the article using data from the Toybox study [60], we calculated minutes of television time per day by following formula: ((min/weekday*5) + (min/weekend day*2))/7. The highest levels of television time were observed within the article containing data from the Pro Children study (9-11-year-olds), followed by the article containing usual frequency questionnaire data from the ENERGY study (10-12-year-olds).
Fig. 2.
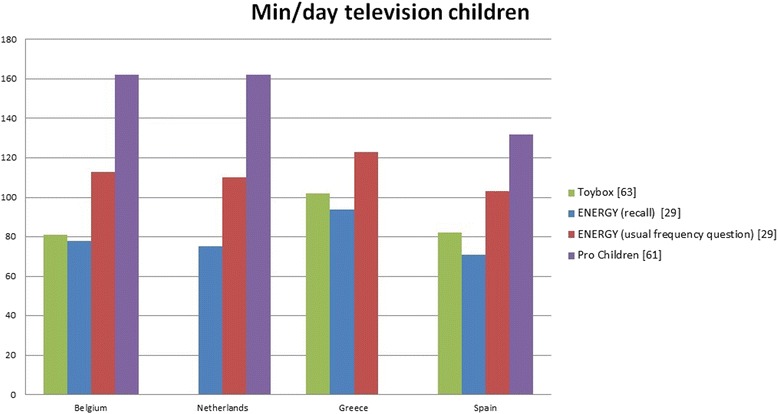
Minutes per day of television viewing in different articles for children from four European countries
Variation in assessment methods and reported sedentary time variables
Table 4 provides an overview of the assessment methods and sedentary time outcome variables used in the retrieved articles. To describe this variation, we have again included all eligible articles (n = 42), as articles from the same European study sometimes reported different outcome variables or reported the same outcome variable differently. Some articles used several assessment methods and/or reported several outcome variables. Most articles used a child questionnaire (n = 25), with others using accelerometers (n = 10). Interview with parents was conducted in one study, and in three other studies adolescents were asked to complete an ecological momentary assessment. Questionnaires were used to assess time spent in domains of sedentary time, whilst accelerometers were used to assess total sedentary time. With regard to the domains of sedentary time, television time was assessed in 24 articles, computer time in 15 articles, total screen-time in 11 articles and total sedentary time in 10 articles. Some articles described a specific time period, such as before (n = 1), during (n = 2) and after school hours (n = 3). The outcome variables were mostly expressed in minutes (n = 16) or hours (n = 11) over a specific time period or the percentage exceeding more than 2 h per day (n = 12).
Table 4.
Assessment methods and reported outcome variables in the articles included in the systematic review
| Number | Reference number | |
|---|---|---|
| Measurement | ||
| ActiGraph accelerometer (100 cpm cut-point and 10 min non-wear time) | 1 | EYHS[36] |
| ActiGraph accelerometer (100 cpm cut-point and 20 min non-wear time) | 6 | ENERGY [31–33], EYHS [37], ISCOLE [58, 59] |
| ActiGraph accelerometer (100 cpm cut-point and 60 min non-wear time) | 2 | ICAD [52, 53] |
| ActiGraph accelerometer (500 cpm cut-point and 10 min non-wear time) | 1 | EYHS [34] |
| Self-administered child questionnaire | 25 | [25, 26], COSI [27], ENERGY [28–30], EYHS [35, 38], HBSC 01/02 [39–43], HBSC 05/06 [44–46], HBSC 09/10 [47–49], HBSC 13/14 [50], ICAD [51], ISAAC [57], ISCOLE [59], Pro Children [60, 61] |
| Self-administered parental questionnaire | 7 | ICAD [51], IDEFICS [54–56], ISAAC [57], Toybox [62, 63] |
| Parental questionnaire interview | 1 | Toybox [63] |
| Ecological Momentary Assessment Diary | 3 | [22–24] |
| Child and parental questionnaire: question type | ||
| Usual frequency | 28 | [26], COSI [27], ENERGY [28–30], EYHS [35, 38], HBSC 01/02 [39–43], HBSC 05/06 [44–46], HBSC 09/10 [47–49], HBSC 13/14 [50], ICAD [51], IDEFICS [54–56], ISAAC [57], ISCOLE [59], Pro Children [60, 61], Toybox [62] |
| Recall | 1 | ENERGY [28] |
| Unknown | 2 | [25], Toybox [63] |
| Child and parental questionnaire: answer type | ||
| Questions with answer categories | 26 | [26], COSI [27], ENERGY [28–30], EYHS [35, 38], HBSC 01/02 [39–43], HBSC 05/06 [44–46], HBSC 09/10 [47–49], HBSC 13/14 [50], IDEFICS [54–56], ISCOLE [59], Pro Children [60, 61], Toybox [62] |
| Questions without answer categories | - | - |
| Unknown | 4 | [25], ICAD [51], ISAAC [57], Toybox [63] |
| Reported specific sedentary time variable | ||
| Total sedentary time | 10 | ENERGY [31–33], EYHS [34, 36, 37], ICAD [52, 53], ISCOLE [58, 59] |
| Television time | 24 | [23–26], COSI[27], ENERGY [28], EYHS [35, 38], HBSC 01/02 [39–43], HBSC 05/06 [44–46], HBSC 09/10 [48, 49], HBSC 13/14 [50], ISAAC [57], Pro Children [60, 61], Toybox [62, 63] |
| Computer time | 15 | [23, 24], COSI [27], ENERGY [28], EYHS [35, 38], HBSC 01/02 [39, 43], HBSC 05/06 [44–46], HBSC 09/10 [47, 49], HBSC 13/14 [50], Toybox [62] |
| Videogames time | 6 | [23, 24], HBSC 05/06 [44–46], HBSC 13/14 [50] |
| Screen-time | 11 | [22], COSI [27], ENERGY [28–30], ICAD [51], IDEFICS [54–56], ISCOLE [59], Toybox [62] |
| Homework | 3 | [23, 24], HBSC 01/02 [43] |
| Other sedentary activities | 4 | [22–24], Toybox [62] |
| Reported time period | ||
| Day | 28 | [24, 25],COSI [27], ENERGY [28–30, 32], EYHS [34, 35, 37, 38], HBSC 01/02 [41, 42], HBSC 05/06 [44, 45], ICAD [51–53], IDEFICS [54–56], ISAAC [57], ISCOLE [58, 59], Pro Children [60, 61], Toybox [62, 63] |
| Weekday | 14 | [22, 23, 26], EYHS [36, 37], HBSC 01/02 [39, 40, 43], HBSC 05/06 [46], HBSC 09/10 [47–49], HBSC 13/14 [50], Toybox [62] |
| Weekend day | 8 | [22, 23], EYHS [36, 37], HBSC 01/02 [40, 43], HBSC 09/10 [49], Toybox [62] |
| School time | 2 | ENERGY [31], EYHS [36] |
| Before school | 1 | EYHS [38] |
| After school | 3 | EYHS [35, 36, 38] |
| Reported unit | ||
| Minutes | 16 | [22–24], ENERGY [28–33], EYHS [36, 37], HBSC 09/10 [47], ICAD [52, 53], ISCOLE [58], Toybox [62] |
| Hours | 11 | COSI [27], EYHS [38], HBSC 01/02 [40, 42], HBSC 05/06 [45], HBSC 09/10 [47, 49], ISAAC [57], ISCOLE [59], Pro Children [60], Toybox [63] |
| % of time period | 2 | ENERGY [31], EYHS [34] |
| % >1 hour | 5 | EYHS [35, 38], IDEFICS [55, 56], Toybox [62] |
| % >2 hours | 12 | [25], EYHS [35, 38], HBSC 01/02 [39], HBSC 05/06 [44, 46], HBSC 09/10 [48], HBSC 13/14 [50], ICAD [51], IDEFICS [56], ISCOLE [59], Pro Children [61] |
| % >3 hours | 2 | HBSC 01/02 [39, 43] |
| % >4 hours | 2 | HBSC 01/02 [41, 43] |
| % not at all, <0.5 h, 0.5-1 h, 1-2 h, 2-3 h, >3 h | 1 | IDEFICS [54] |
| % <0.5 h, 1-2 h, 3-4 h, >4 h | 1 | [26] |
| % <1 h, 1-3 h, 3-5 h, >5 h | 1 | ISAAC [57] |
h hours, COSI WHO European Childhood Obesity Surveillance Initiative, ENERGY EuropeaN Energy balance Research to prevent excessive weight Gain among Youth, EYHS European Youth Heart Study, HBSC Health Behaviour in School-aged Children, ICAD International Children’s Accelerometer Database, IDEFICS Identification and prevention of Dietary and lifestyle induced health Effects In Children and infantS, ISAAC International Study of Asthma and Allergies in Childhood, ISCOLE The International Study of Childhood Obesity, Lifestyle and the Environment
Discussion
This systematic review aimed to provide an overview of existing cross-European studies assessing sedentary time in children (0-12y) and adolescents (13-18y), to describe the variation in population levels of sedentary time and to discuss the impact of assessment methods.
Overview of existing cross-European studies
The literature search revealed 42 articles reporting on levels of sedentary time. Thus, the current systematic review included the highest number of eligible articles in comparison with the other three reviews on sedentary time in adults and on physical activity in youth and adults [16–18]. Although sedentary time has only received increased attention in the last few years, earlier studies have described children and adolescents’ television and screen-time [64].
Nine articles that were part of the HBSC-studies included the most countries (up to 36), but there were still some countries for which no data were available in cross-European studies. These countries should therefore be included in further European surveillance studies in order to have a complete overview of the sedentary time levels among children and adolescents. Since 38 of 42 articles were cross-sectional, future longitudinal studies could shed light on how sedentary time varies over time in the same population of children and adolescents. However, conducting repeated cross-sectional studies is also of importance in terms of public health to understand trends in sedentary time.
Variation in population levels of sedentary time and impact of assessment methods
The tables with data on the levels of sedentary time in children and adolescents across European countries might be useful for European researchers and policy makers, as they provide an orderly reference work of conducted cross-European studies. One general conclusion that we might draw from the results is that children and adolescents from Eastern-European countries (i.e. the more eastern part of Europe such as Bulgaria, Slovakia, Ukraine) have somewhat higher levels of sedentary time compared to the rest of Europe. However, there are several plausible reasons for the large differences observed between articles. First, different assessment methods were used. Child-specific questionnaires were used in 60 % of the articles and were only designed to measure time spent in domain-specific sedentary activities. Accelerometers were the only assessment methods that measured the total sitting time and were used in 24 % of the articles, probably because greater cost incurred in using accelerometers in large-scale studies. However, as technological advances have made the accelerometers smaller, lighter, and less expensive, it has been argued that the accelerometer has now become feasible for use in large-scale studies. An important remark is that standard procedures to process accelerometer data are then needed [65]. To estimate children’s total sedentary time via accelerometers, sedentary time was measured by summing the recorded epochs during which the average accelerometer counts were equivalent to less than 100 counts per minute, which is the most commonly used threshold for sedentary time measurement [66, 67]. Another assessment method that might also be less feasible to use in large-scale studies is the ecological momentary assessment tool. This method was used in three cross-European articles, but included a rather limited number of participants and countries, as this assessment method brings along a high time burden for participants. Next to variation in assessment methods, the included articles also reported different outcome variables (e.g. television time vs. total screen-time) or reported the same outcome variable differently (e.g. television time expressed in minutes per day vs. expressed in the percentage exceeding the 2 h recommendation). Finally, the amount of sedentary time was observed to substantially vary in individual countries across different articles. Among Estonian female adolescents for example, total sedentary time on a weekday was less than six hours in one article [36] and almost nine hours in another article [37]. These differences might have emerged because of age differences between study samples. In this review, separate tables were designed for children and adolescents, but age differences can still cause the differences in population levels between and within countries, as the amount of sedentary time increases with age [68]. Thus, because of these large methodological differences between studies, we want to emphasise that cross-European comparisons are currently only possible within studies.
Limitations and strengths
This review has some limitations that should be acknowledged. A first limitation is that although the search was performed in several databases in combination with multiple additional search strategies (e.g. back- and forward tracking), there is still a possibility that not all existing studies on this topic were covered. Some articles might not be found in our databases searched or through our search strategy. The use of including only English published data might also contribute to this limitation, although we expect that results of cross-European studies would be published in English. Another possible limitation could be that only cross-European studies were included. Single-country studies may have provided additional information. However, the purpose was to specifically review the literature on cross-country studies so that the results across countries would at least be comparable within articles [15]. This also means that cross-European studies that did not report the outcome separately per country were excluded in the review, such as the HELENA (Healthy lifestyle in Europe by nutrition in adolescence) study [69]. An important strength is the systematic process: there was a written protocol for all four reviews that was agreed upon by all involved researchers and the search, article selection, data extraction and quality assessment were conducted together for all four reviews. Also, each step of the review process has been conducted by two independent researchers with issues being resolved by consulting a third researcher.
Recommendations for the future
This systematic literature review showed that there is a need for harmonisation and standardisation of methods to assess sedentary time in European children and adolescents. The same conclusion was drawn from the other systematic reviews conducted within DEDIPAC for sedentary time in adults and for physical activity in youth and adults [16–18]. A possible approach for the future could be to add objective assessment methods in existing large cross-European surveillance systems, such as the HBSC-study. Another approach could be to conduct a pooled analysis on existing data of European children and adolescents (and adults). This is similar as the approach of the International children’s accelerometry database (ICAD) which collected, pooled and reduced individual accelerometer data files using standardised methods to compare the outcome variables across studies [70]. However, it might be difficult to obtain accelerometer data from all European countries, as few countries have population representative accelerometer data. Conducting a pooled analysis on existing questionnaire data would also be difficult, as harmonisation of data from different questionnaires is even more challenging. A final approach could be to set up a new cross-European surveillance system combining objective and self-report methods (for example, accelerometers and questionnaires) to monitor levels of sedentary time and physical activity in children, adolescents and adults.
Conclusion
Generally, higher levels of sedentary time were observed in children and adolescents from Eastern-European countries. There was a large variation in assessment methods and outcome variables across cross-European studies. Questionnaires (child specific) were used most often, probably because of feasibility reasons. These self-report measures mostly measured screen-based activities only, rather than total sedentary time. In sum, to enable cross-European surveillance, there is a need for harmonisation and standardisation of methods to assess sedentary time in European children and adolescents. Such a surveillance system should combine objective and self-report methods.
Abbreviations
B, boys; COSI, WHO European childhood obesity surveillance initiative; ENERGY, EuropeaN energy balance research to prevent excessive weight gain among youth; ENG, England; EYHS, European youth heart study; FG, usual frequency question; FL, Flemish part of Belgium; FR, French part of Belgium; G, girls; h, hour; HBSC, health behaviour in school-aged children; ICAD, International Children’s Accelerometer Database; IDEFICS, identification and prevention of dietary and lifestyle induced health Effects In Children and infantS; ISAAC, International Study of Asthma and Allergies in Childhood; ISCOLE, The International Study of Childhood Obesity, Lifestyle and the Environment; min, minutes; SC, Scotland; SES, socio-economic status; WAL, Wales
Acknowledgements
Not applicable.
Funding
The preparation of this paper was supported by the DEterminants of DIet and Physical ACtivity (DEDIPAC) knowledge hub. This work is supported by the Joint Programming Initiative ‘Healthy Diet for a Healthy Life’. The funding agencies supporting this work are (in alphabetical order of participating Member State): Belgium: Research Foundation – Flanders; Ireland: The Health Research Board (HRB); The Netherlands: The Netherlands Organisation for Health Research and Development (ZonMw); Norway: The Research Council of Norway, Division for Society and Health.
Availability of data and supporting materials
Not applicable.
Authors’ contributions
MV, AL and LvH conducted the search, article selection, data extraction and quality assessment and drafted the manuscript. JL, IH, IDB, BD, AD, UE, JB, HvdP conceptualised and designed the study. All authors were involved in critically revising the manuscript for important intellectual content and have read and approved the final manuscript.
Competing interests
The authors declare that they have no competing interests.
Consent for publication
Not applicable.
Ethics approval and consent to participate
Not applicable.
Additional files
PRISMA 2009 Checklist. (PDF 195 kb)
Search strategy. (PDF 175 kb)
Data extraction file. (XLSX 80 kb)
Quality assessment file. (PDF 252 kb)
Contributor Information
Maïté Verloigne, Email: maite.verloigne@ugent.be.
Anne Loyen, Phone: +31 20 4445271, Email: a.loyen@vumc.nl.
Linde Van Hecke, Email: linde.vanhecke@ugent.be.
Jeroen Lakerveld, Email: je.lakerveld@vumc.nl.
Ingrid Hendriksen, Email: hendriksenijm@gmail.com.
Ilse De Bourdheaudhuij, Email: ilse.debourdeaudhuij@ugent.be.
Benedicte Deforche, Email: benedicte.deforche@ugent.be.
Alan Donnelly, Email: alan.donnelly@ul.ie.
Ulf Ekelund, Email: ulf.ekelund@nih.no.
Johannes Brug, Email: j.brug@vumc.nl.
Hidde P. van der Ploeg, Email: hp.vanderploeg@vumc.nl
References
- 1.Sedentary Behaviour Research Network Letter to the Editor: Standardized use of the terms “sedentary” and “sedentary behaviours.”. Appl Physiol Nutr Metab. 2012;37:540–542. doi: 10.1139/h2012-024. [DOI] [PubMed] [Google Scholar]
- 2.Maher C, Olds T, Mire E, Katzmarzyk PT. Reconsidering the sedentary behaviour paradigm. PLoS One. 2014;9(1):e86403. doi: 10.1371/journal.pone.0086403. [DOI] [PMC free article] [PubMed] [Google Scholar]
- 3.Pulsford RM, Stamatakis E, Britton AR, Brunner EJ, Hillsdon M. Associations of sitting behaviours with all-cause mortality over a 16-year follow-up: the Whitehall II study. Int J Epidemiol. 2015;44(6):1909–1916. doi: 10.1093/ije/dyv191. [DOI] [PMC free article] [PubMed] [Google Scholar]
- 4.de Rezende LF, Rodrigues Lopes M, Rey-López JP, Matsudo VK, Luiz OC. Sedentary behavior and health outcomes: an overview of systematic reviews. PLoS One. 2014;9(8):e105620. doi: 10.1371/journal.pone.0105620. [DOI] [PMC free article] [PubMed] [Google Scholar]
- 5.Proper KI, Singh AS, van Mechelen W, Chinapaw MJ. Sedentary behaviors and health outcomes among adults: a systematic review of prospective studies. Am J Prev Med. 2011;40(2):174–182. doi: 10.1016/j.amepre.2010.10.015. [DOI] [PubMed] [Google Scholar]
- 6.Thorp AA, Owen N, Neuhaus M, Dunstan DW. Sedentary behaviors and subsequent health outcomes in adults. A systematic review of longitudinal studies, 1996-2011. Am J Prev Med. 2011;41(2):207–215. doi: 10.1016/j.amepre.2011.05.004. [DOI] [PubMed] [Google Scholar]
- 7.van der Ploeg HP, Chey T, Korda RJ, Banks E, Bauman A. Sitting time and all-cause mortality risk in 222 497 Australian adults. Arch Int Med. 2012;173(6):494–500. doi: 10.1001/archinternmed.2011.2174. [DOI] [PubMed] [Google Scholar]
- 8.Biswas A, Oh PI, Faulkner GE, Bajaj RR, Silver MA, Mitchell MS, Alter DA. Sedentary time and its association with risk for disease incidence, mortality, and hospitalization in adults: a systematic review and meta-analysis. Ann Intern Med. 2015;162(2):123–132. doi: 10.7326/M14-1651. [DOI] [PubMed] [Google Scholar]
- 9.Chau JY, Grunseit AC, Chey T, Stamatakis E, Brown WJ, Matthews CE, Bauman AE, van der Ploeg HP. Daily sitting time and all-cause mortality: a meta-analysis. PLoS One. 2013;8(11):e80000. doi: 10.1371/journal.pone.0080000. [DOI] [PMC free article] [PubMed] [Google Scholar]
- 10.Chinapaw MJM, Proper KI, Brug J, van Mechelen W, Singh AS. Relationship between young peoples’ sedentary behaviour and biomedical health indicators: a systematic review of prospective studies. Obes Rev. 2011;12:e621–e632. doi: 10.1111/j.1467-789X.2011.00865.x. [DOI] [PubMed] [Google Scholar]
- 11.Tremblay MS, Leblanc AG, Kho ME, Saunders TJ, Larouche R, Colley RC, et al. Systematic review of sedentary behaviour and health indicators in school-aged children and youth. Int J Behav Nutr Phys Act. 2011;8:98. doi: 10.1186/1479-5868-8-98. [DOI] [PMC free article] [PubMed] [Google Scholar]
- 12.Chinapaw M, Altenburg T, Brug J. Sedentary behaviour and health in children - evaluating the evidence. Prev Med. 2015;70:1–2. doi: 10.1016/j.ypmed.2014.10.029. [DOI] [PubMed] [Google Scholar]
- 13.Hancox RJ, Milne BJ, Poulton R. Association between child and adolescent television viewing and adult health: a longitudinal birth cohort study. Lancet. 2004;364(9430):257–262. doi: 10.1016/S0140-6736(04)16675-0. [DOI] [PubMed] [Google Scholar]
- 14.Lakerveld J, van der Ploeg HP, Kroeze W, Ahrens W, Allais O, Andersen LF, et al. Towards the integration and development of a cross-European research network and infrastructure: the DEterminants of DIet and Physical ACtivity (DEDIPAC) Knowledge Hub. Int J Behav Nutr Phys Act. 2014;11:143. doi: 10.1186/s12966-014-0143-7. [DOI] [PMC free article] [PubMed] [Google Scholar]
- 15.World Health Organization Regional Office for Europe . Review of Physical Activity Surveillance Data Sources in European Union Member States. 2010. [Google Scholar]
- 16.Loyen A, Verloigne M, Van Hecke L, Hendriksen I, Lakerveld J, Steene-Johannessen J, et al. A systematic review on the variation in adult population levels of sedentary time in European adults according to pan-European studies across European countries: a DEDIPAC-study. Int J Behav Nutr Phys Act. In revision. doi:10.1186/s12966-016-0397-3 [DOI] [PMC free article] [PubMed]
- 17.Loyen A, Van Hecke L, Verloigne M, Hendriksen I, Lakerveld J, Steene-Johannessen J, et al. A systematic review on the variation in adult population levels of physical activity in European adults according to pan-European studies across European countries: a DEDIPAC-study. Int J Behav Nutr Phys Act. In revision. doi:10.1186/s12966-016-0398-2
- 18.Van Hecke L, Loyen A, Verloigne M, van der Ploeg HP, Lakerveld J, Brug J, et al. Variation in population levels of physical activity in European children and adolescents according to cross-European studies: a systematic literature review within DEDIPAC. In revision. doi:10.1186/s12966-016-0396-4 [DOI] [PMC free article] [PubMed]
- 19.CRD . Systematic Reviews CRD’s guidance for undertaking reviews in health care. 2009. [Google Scholar]
- 20.Council of Europe - Our Member States. Available at: http://www.coe.int/en/web/about-us/our-member-states. Accessed 2 May 2016.
- 21.Kmet LM, Lee RC, Cook LS. HTA Initiative # 13. Standard quality assessment criteria for evaluating primary research papers from a variety of fields. HTA Initiative. 2004;2:13. [Google Scholar]
- 22.Biddle SJH, Soos I, Hamar P, Sandor I, Simonek J, Karsai I. Physical activity and sedentary behaviours in youth: data from three Central-Eastern European countries. Eur Coll Sport Sci. 2009;9(5):295–301. doi: 10.1080/17461390902829234. [DOI] [Google Scholar]
- 23.Soos I, Biddle S, Boros-Balint I, Sandor I, Szabo P, Hamar P, et al. Prevalence of sedentary behaviours in young people in Romania and Slovakia. Eur Phys Edu Rev. 2012;18:19. doi: 10.1177/1356336X11430659. [DOI] [Google Scholar]
- 24.Soos I, Biddle SJH, Ling J, Hamar P, Sandor I, Boros-Balint I, et al. Physical activity, sedentary behaviour, use of electronic media, and snacking among youth: an international study. Kinesiology. 2014;46(2):155–163. [Google Scholar]
- 25.Cinnar B, Murtomaa H. Clustering of obesity and dental health with lifestyle factors among Turkish and Finnish pre-adolescents. Obes Facts. 2008;1:196–202. doi: 10.1159/000145931. [DOI] [PMC free article] [PubMed] [Google Scholar]
- 26.Hanewinkel R, Sargent JD, Poelen EA, Scholte R, Florek E, Sweeting H, et al. Alcohol consumption in movies and adolescent binge drinking in 6 European countries. Pediatrics. 2012;129(4):709–20. doi: 10.1542/peds.2011-2809. [DOI] [PMC free article] [PubMed] [Google Scholar]
- 27.Börnhorst C, Wijnhoven TM, Kunešová M, Yngve A, Rito AI, Lissner L, et al. WHO European Childhood Obesity Surveillance Initiative: associations between sleep duration, screen time and food consumption frequencies. BMC Public Health. 2015;15:442. doi: 10.1186/s12889-015-1793-3. [DOI] [PMC free article] [PubMed] [Google Scholar]
- 28.Brug J, van Stralen MM, Te Velde SJ, Chinapaw MJ, De Bourdeaudhuij I, Lien N, et al. Differences in weight status and energy-balance related behaviors among schoolchildren across Europe: the ENERGY-project. PloS One. 2012;7(4):e34742. doi: 10.1371/journal.pone.0034742. [DOI] [PMC free article] [PubMed] [Google Scholar]
- 29.Brug J, van Stralen MM, Chinapaw MJ, De Bourdeaudhuij I, Lien N, Bere E, et al. Differences in weight status and energy-balance related behaviours according to ethnic background among adolescents in seven countries in Europe: the ENERGY-project. Pediatr Obes. 2012;7(5):399–411. doi: 10.1111/j.2047-6310.2012.00067.x. [DOI] [PubMed] [Google Scholar]
- 30.Fernández-Alvira JM, De Bourdeaudhuij I, Singh AS, Vik FN, Manios Y, Kovacs E, et al. Clustering of energy balance-related behaviors and parental education in European children: the ENERGY-project. Int J Behav Nutr Phys Act. 2013;10:5. doi: 10.1186/1479-5868-10-5. [DOI] [PMC free article] [PubMed] [Google Scholar]
- 31.van Stralen MM, Yıldırım M, Wulp A, te Velde SJ, Verloigne M, Doessegger A, et al. Measured sedentary time and physical activity during the school day of European 10- to 12-year-old children: the ENERGY project. J Sci Med Sport. 2014;17(2):201–206. doi: 10.1016/j.jsams.2013.04.019. [DOI] [PubMed] [Google Scholar]
- 32.Verloigne M, Van Lippevelde W, Maes L, Yıldırım M, Chinapaw M, Manios Y, et al. Levels of physical activity and sedentary time among 10- to 12-year-old boys and girls across 5 European countries using accelerometers: an observational study within the ENERGY-project. Int J Behav Nutr Phys Act. 2012;9:34. doi: 10.1186/1479-5868-9-34. [DOI] [PMC free article] [PubMed] [Google Scholar]
- 33.Yıldırım M, Schoeni A, Singh AS, Altenburg TM, Brug J, De Bourdeaudhuij I, et al. Daily variations in weather and the relationship with physical activity and sedentary time in European 10- to 12-year-olds: the ENERGY-project. J Phys Act Health. 2014;11:41–425. doi: 10.1123/jpah.2012-0102. [DOI] [PubMed] [Google Scholar]
- 34.Ekelund U, Sardinha LB, Anderssen SA, Harro M, Franks PW, Brage S, et al. Associations between objectively assessed physical activity and indicators of body fatness in 9- to 10-y-old European children: a population-based study from 4 distinct regions in Europe (the European Youth Heart Study) Am J Clin Nutr. 2004;80(3):584–590. doi: 10.1093/ajcn/80.3.584. [DOI] [PubMed] [Google Scholar]
- 35.Jago R, Page A, Froberg K, Sardinha LB, Klasson-Heggebø L, Andersen LB. Screen-viewing and the home TV environment: the European Youth Heart Study. Prev Med. 2008;47(5):525–529. doi: 10.1016/j.ypmed.2008.07.016. [DOI] [PubMed] [Google Scholar]
- 36.Nilsson A, Anderssen SA, Andersen LB, Froberg K, Riddoch C, Sardinha LB, Ekelund U. Between- and within-day variability in physical activity and inactivity in 9- and 15-year-old European children. Scand J Med Sci Sports. 2009;19(1):10–18. doi: 10.1111/j.1600-0838.2007.00762.x. [DOI] [PubMed] [Google Scholar]
- 37.Ortega FB, Konstabel K, Pasquali E, Ruiz JR, Hurtig-Wennlöf A, Mäestu J, et al. Objectively measured physical activity and sedentary time during childhood, adolescence and young adulthood: a cohort study. PLoS One. 2013;8(4):e60871. doi: 10.1371/journal.pone.0060871. [DOI] [PMC free article] [PubMed] [Google Scholar]
- 38.van Sluijs EM, Page A, Ommundsen Y, Griffin SJ. Behavioural and social correlates of sedentary time in young people. Br J Sports Med. 2010;44(10):747–755. doi: 10.1136/bjsm.2008.049783. [DOI] [PubMed] [Google Scholar]
- 39.Janssen I, Katzmarzyk PT, Boyce WF, Vereecken C, Mulvihill C, Roberts C, et al. Comparison of overweight and obesity prevalence in school-aged youth from 34 countries and their relationships with physical activity and dietary patterns. Obes Rev. 2005;6(2):123–132. doi: 10.1111/j.1467-789X.2005.00176.x. [DOI] [PubMed] [Google Scholar]
- 40.Kuntsche E, Pickett W, Overpeck M, Craig W, Boyce W, de Matos MG. Television viewing and forms of bullying among adolescents from eight countries. J Adolesc Health. 2006;39(6):908–915. doi: 10.1016/j.jadohealth.2006.06.007. [DOI] [PubMed] [Google Scholar]
- 41.Richter M, Vereecken CA, Boyce W, Maes L, Gabhainn SN, Currie CE. Parental occupation, family affluence and adolescent health behaviour in 28 countries. Int J Public Health. 2009;54(4):203–212. doi: 10.1007/s00038-009-8018-4. [DOI] [PubMed] [Google Scholar]
- 42.Vereecken CA, Todd J, Roberts C, Mulvihill C, Maes L. Television viewing behaviour and associations with food habits in different countries. Public Health Nutr. 2006;9(2):244–250. doi: 10.1079/PHN2005847. [DOI] [PubMed] [Google Scholar]
- 43.Currie C, Roberts C, Morgan A, Smith R, Settertobulte W, Samdal O, et al. (eds) Young People’s Health in Context: international report from the HBSC 2001/02 survey. Health Policy for Children and Adolescents, No.4. Copenhagen: WHO Regional Office for Europe; 2004.
- 44.Haug E, Rasmussen M, Samdal O, Iannotti R, Kelly C, Borraccino A, et al. Overweight in school-aged children and its relationship with demographic and lifestyle factors: results from the WHO-Collaborative Health Behaviour in School-aged Children (HBSC) study. Int J Public Health. 2009;54(2):167–179. doi: 10.1007/s00038-009-5408-6. [DOI] [PMC free article] [PubMed] [Google Scholar]
- 45.Torsheim T, Eriksson L, Schnohr CW, Hansen F, Bjarnason T, Välimaa R. Screen-based activities and physical complaints among adolescents from the Nordic countries. BMC Public Health. 2010;10:324. doi: 10.1186/1471-2458-10-324. [DOI] [PMC free article] [PubMed] [Google Scholar]
- 46.Currie C, Nic Gabhainn S, Godeau E, Roberts C, Smith R, Currie D, et al. (eds) Inequalities in young people’s health: HBSC international report from the 2005/06 Survey. Health Policy for Children and Adolescents, No. 5. Copenhagen, Denmark: WHO Regional Office for Europe; 2008.
- 47.Nuutinen T, Roos E, Ray C, Villberg J, Välimaa R, Rasmussen M, et al. Computer use, sleep duration and health symptoms: a cross-sectional study of 15-year olds in three countries. Int J Public Health. 2014;59(4):619–628. doi: 10.1007/s00038-014-0561-y. [DOI] [PubMed] [Google Scholar]
- 48.Currie C, Zanotti C, Morgan A, Currie D, de Looze M, Roberts C, et al. (eds) Social determinants of health and well-being among young people. Health Behaviour in School-aged Children (HBSC) study: international report from the 2009/2010 survey. Health Policy for Children and Adolescents, No. 6. Copenhagen, Denmark: WHO Regional Office for Europe; 2012.
- 49.Bucksch J, Sigmundova D, Hamrik Z, Troped PJ, Melkevik O, Ahluwalia N, et al. International trends in adolescent screen-time behaviors from 2002 to 2010. J Adolesc Health. 2016;58(4):417–425. doi: 10.1016/j.jadohealth.2015.11.014. [DOI] [PubMed] [Google Scholar]
- 50.Inchley J, Currie D, Young T, Samdal O, Torsheim T, Augustson L, et al. (eds) Growing up unequal: gender and socioeconomic differences in young people’s health and well-being. Health Behaviour in School-aged Children (HBSC) study: international report from the 2013/2014 survey. Health Policy for Children and Adolescents, No. 7. Copenhagen, Denmark: WHO Regional Office for Europe;2016.
- 51.Atkin AJ, Sharp SJ, Corder K, van Sluijs EM, International Children’s Accelerometry Database (ICAD) Collaborators Prevalence and correlates of screen time in youth: an international perspective. Am J Prev Med. 2014;47(6):803–807. doi: 10.1016/j.amepre.2014.07.043. [DOI] [PubMed] [Google Scholar]
- 52.Ekelund U, Luan J, Sherar LB, Esliger DW, Griew P. Cooper A; International Children’s Accelerometry Database (ICAD) Collaborators. Moderate to vigorous physical activity and sedentary time and cardiometabolic risk factors in children and adolescents. JAMA. 2012;307(7):704–712. doi: 10.1001/jama.2012.156. [DOI] [PMC free article] [PubMed] [Google Scholar]
- 53.Hildebrand M, Kolle E, Hansen BH, Collings PJ, Wijndaele K, Kordas K, et al. Association between birth weight and objectively measured sedentary time is mediated by central adiposity: data in 10,793 youth from the International Children’s Accelerometry Database. Am J Clin Nutr. 2015;101(5):983–990. doi: 10.3945/ajcn.114.103648. [DOI] [PMC free article] [PubMed] [Google Scholar]
- 54.Hense S, Barba G, Pohlabeln H, De Henauw S, Marild S, Molnar D, et al. Factors that influence weekday sleep duration in European children. Sleep. 2011;34(5):633–639. doi: 10.1093/sleep/34.5.633. [DOI] [PMC free article] [PubMed] [Google Scholar]
- 55.Hunsberger M, Formisano A, Reisch LA, Bammann K, Moreno L, De Henauw S, et al. Overweight in singletons compared to children with siblings: the IDEFICS study. Nutr Diabetes. 2012;2:e35. doi: 10.1038/nutd.2012.8. [DOI] [PMC free article] [PubMed] [Google Scholar]
- 56.Kovács E, Hunsberger M, Reisch L, Gwozdz W, Eiben G, De Bourdeaudhuij I, et al. Adherence to combined lifestyle factors and their contribution to obesity in the IDEFICS study. Obes Rev. 2015;16(2):138–150. doi: 10.1111/obr.12349. [DOI] [PubMed] [Google Scholar]
- 57.Mitchell EA, Beasley R, Björkstén B, Crane J, García-Marcos L, Keil U, ISAAC Phase Three Study Group The association between BMI, vigorous physical activity and television viewing and the risk of symptoms of asthma, rhinoconjunctivitis and eczema in children and adolescents: ISAAC Phase Three. Clin Exp Allergy. 2013;43(1):73–84. doi: 10.1111/cea.12024. [DOI] [PubMed] [Google Scholar]
- 58.Katzmarzyk PT, Barreira TV, Broyles ST, Champagne CM, Chaput JP, Fogelholm M, et al. Physical Activity, sedentary time, and obesity in an international sample of children. Med Sci Sports Exerc. 2015;47(10):2062–2069. doi: 10.1249/MSS.0000000000000649. [DOI] [PubMed] [Google Scholar]
- 59.LeBlanc AG, Katzmarzyk PT, Barreira TV, Broyles ST, Chaput JP, Church TS, et al. Correlates of total sedentary time and screen time in 9-11 year-old children around the world: The International Study of Childhood Obesity, Lifestyle and the Environment. PLoS One. 2015;10(6):e0129622. doi: 10.1371/journal.pone.0129622. [DOI] [PMC free article] [PubMed] [Google Scholar]
- 60.Klepp KI, Wind M, de Bourdeaudhuij I, Rodrigo CP, Due P, Bjelland M, Brug J. Television viewing and exposure to food-related commercials among European school children, associations with fruit and vegetable intake: a cross sectional study. Int J Behav Nutr Phys Act. 2007;4:46. doi: 10.1186/1479-5868-4-46. [DOI] [PMC free article] [PubMed] [Google Scholar]
- 61.te Velde SJ, De Bourdeaudhuij I, Thorsdottir I, Rasmussen M, Hagströmer M, Klepp KI, Brug J. Patterns in sedentary and exercise behaviors and associations with overweight in 9-14-year-old boys and girls--a cross-sectional study. BMC Public Health. 2007;7:16. doi: 10.1186/1471-2458-7-16. [DOI] [PMC free article] [PubMed] [Google Scholar]
- 62.De Craemer M, Lateva M, Iotova V, De Decker E, Verloigne M, De Bourdeaudhuij I, et al. Differences in energy balance-related behaviours in European preschool children: the ToyBox-study. PLoS One. 2015;10(3):e0118303. doi: 10.1371/journal.pone.0118303. [DOI] [PMC free article] [PubMed] [Google Scholar]
- 63.van Stralen MM, te Velde SJ, van Nassau F, Brug J, Grammatikaki E, Maes L, et al. Weight status of European preschool children and associations with family demographics and energy balance-related behaviours: a pooled analysis of six European studies. Obes Rev. 2012;13(1):29–41. doi: 10.1111/j.1467-789X.2011.00959.x. [DOI] [PubMed] [Google Scholar]
- 64.Owen N, Healy GN, Matthews CE, Dunstan DW. Too much sitting: the population health science of sedentary behavior. Exerc Sport Sci Rev. 2010;38(3):105–113. doi: 10.1097/JES.0b013e3181e373a2. [DOI] [PMC free article] [PubMed] [Google Scholar]
- 65.Lee IM, Shiroma EJ. Using accelerometers to measure physical activity in large-scale epidemiological studies: issues and challenges. Br J Sports Med. 2014;48(3):197–201. doi: 10.1136/bjsports-2013-093154. [DOI] [PMC free article] [PubMed] [Google Scholar]
- 66.Fischer C, Yildirim M, Salmon J, Chinapaw M. Comparing different accelerometer cut-points for sedentary time in children. Pediatr Exerc Sci. 2012;24(2):220–228. doi: 10.1123/pes.24.2.220. [DOI] [PubMed] [Google Scholar]
- 67.Ridgers ND, Salmon J, Ridley K, O’Connell E, Arundell L, Timperio A. Agreement between activPAL and ActiGraph for assessing children’s sedentary time. Int J Behav Nutr Phys Act. 2012;9:15. doi: 10.1186/1479-5868-9-15. [DOI] [PMC free article] [PubMed] [Google Scholar]
- 68.Stierlin AS, De Lepeleere S, Cardon G, Dargent-Molina P, Hoffmann B, Murphy MH, et al. A systematic review of determinants of sedentary behaviour in youth: a DEDIPAC-study. Int J Behav Nutr Phys Act. 2015;12:133. doi: 10.1186/s12966-015-0291-4. [DOI] [PMC free article] [PubMed] [Google Scholar]
- 69.Moreno LA, González-Gross M, Kersting M, Molnár D, de Henauw S, Beghin L, et al. Assessing, understanding and modifying nutritional status, eating habits and physical activity in European adolescents: the HELENA (Healthy Lifestyle in Europe by Nutrition in Adolescence) Study. Public Health Nutr. 2008;11(3):288–299. doi: 10.1017/S1368980007000535. [DOI] [PubMed] [Google Scholar]
- 70.Sherar LB, Griew P, Esliger DW, Cooper AR, Ekelund U, Judge K, Riddoch C. International children’s accelerometery database (ICAD): Design and methods. BMC Public Health. 2011;11:485. doi: 10.1186/1471-2458-11-485. [DOI] [PMC free article] [PubMed] [Google Scholar]