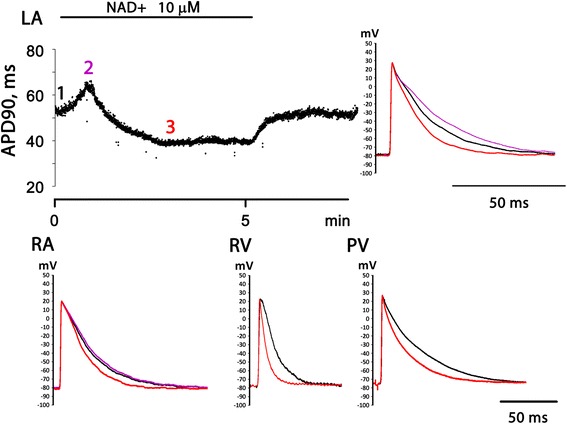
Fig. 1.

Electrophysiological effects of 10 μM NAD+ in various regions of the rat heart. Representative traces of APs recorded in left auricle (LA), right auricle (RA), right ventricular wall (RV) and pulmonary veins (PV) in control conditions and in the presence of NAD+ are superimposed. Black trace – control AP before NAD+ application. Red trace – AP at the moment of maximal negative effect (AP shortening) of NAD+. Magenta trace - AP at the moment of maximal positive effect (AP prolongation) of NAD+. Data from 4 separate representative experiments are shown. At the LA panel the time course of NAD+ effect on AP duration measured at 90 % repolarization level (APD90) is also shown (data from one representative experiment)
